IIoT for Glass Manufacturing: How to Monitor Furnaces, Forming Machines, and Annealing Lehrs in Real Time
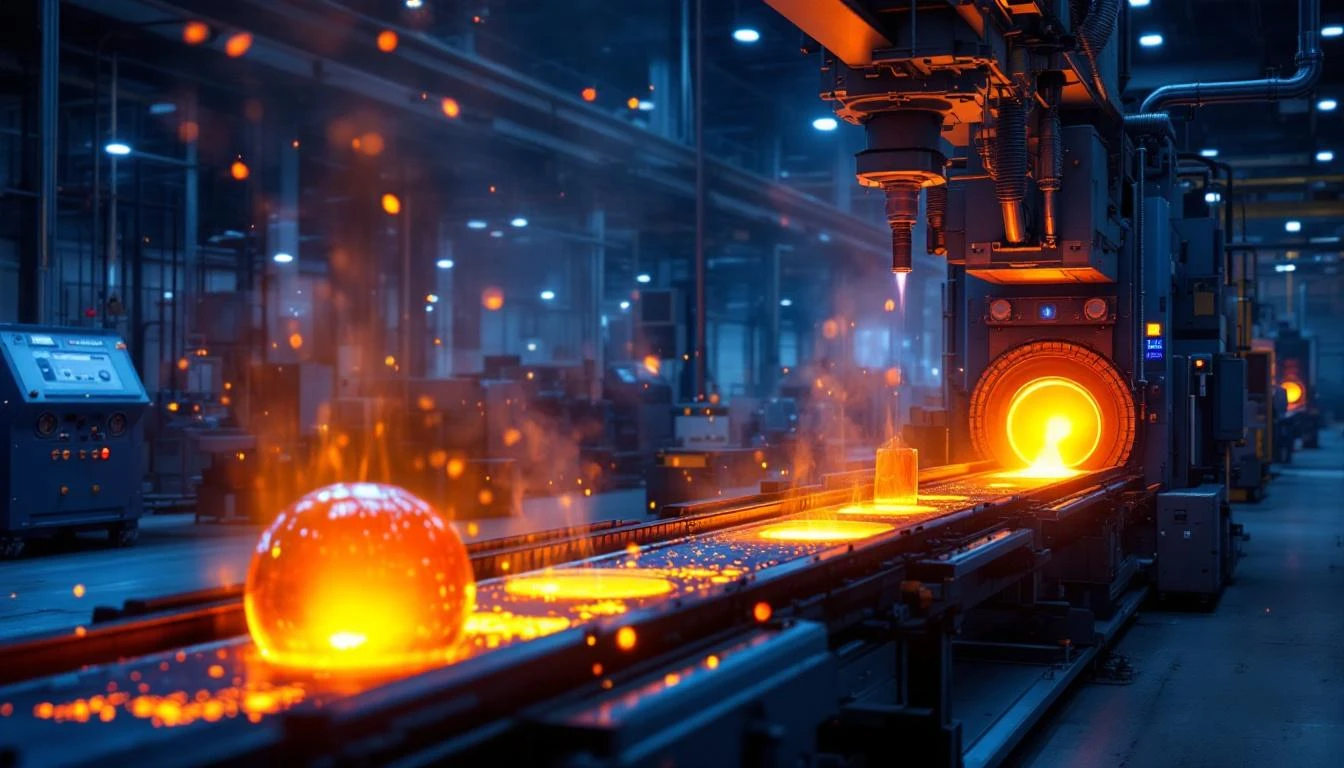
Glass manufacturing is one of the most energy-intensive and thermally demanding processes in all of industrial production. A flat glass furnace operates at 1,550-1,600°C continuously — for 15 to 20 years between rebuilds. A container glass furnace cycles between 1,100°C and 1,550°C thousands of times per day as it feeds gobs to forming machines. The margin between perfect glass and scrap can be measured in single-digit degrees.
In this environment, manual data collection isn't just insufficient — it's dangerous. A refractory failure detected 6 hours late can destroy a furnace worth $20-50 million. A forming temperature deviation undetected for 30 minutes can produce thousands of defective containers. And energy represents 25-35% of total production cost, meaning a 3% efficiency improvement on a furnace burning $8 million in natural gas annually saves $240K.
IIoT monitoring isn't optional for modern glass manufacturing. It's survival.
Why Glass Manufacturing Needs Continuous Monitoring
Glass production has characteristics that make it uniquely dependent on real-time data:
Continuous process: Unlike discrete manufacturing, glass furnaces run 24/7/365 for years. You can't stop the furnace to inspect it. You can't adjust refractory insulation mid-campaign. Every decision about furnace condition must be made with the process running.
Extreme temperatures: Operating temperatures above 1,500°C push materials to their limits. Refractory linings erode, thermocouples drift, electrodes wear. The instruments themselves are being destroyed by the process they're measuring — which means automated monitoring of instrument health is as important as monitoring the process.
Long feedback loops: A change in batch composition at the furnace inlet takes 24-48 hours to appear as a change in glass quality at the forming machine. Without continuous monitoring of every intermediate step, you're flying blind for two days after every process adjustment.
Massive energy consumption: A typical container glass furnace consumes 3-6 million BTU per ton of glass melted. Float glass furnaces consume 5-8 million BTU per ton. With natural gas prices volatile and carbon reduction mandates tightening, energy efficiency isn't just a cost issue — it's a regulatory and existential one.
Critical Monitoring Points in Glass Production
Batch House and Raw Materials
Before glass is melted, raw materials (silica sand, soda ash, limestone, dolomite, cullet) must be weighed, mixed, and transported to the furnace. The batch composition determines glass properties — getting it wrong wastes energy (re-melting) and produces off-spec glass.
Key parameters to monitor:
- Scale accuracy — drift in batch scales produces composition errors that compound over days
- Moisture content — wet sand weighs more; 2% moisture variation in silica equals 2% composition error
- Cullet ratio — recycled glass content affects melting energy (every 10% increase in cullet reduces energy by 2.5-3%)
- Batch blanket depth — the unmelted material floating on the glass surface; too thin = energy waste, too thick = melting problems
- Conveyor speeds — mismatched speeds between batch charger and furnace demand create batch islands
IIoT value: Continuous weight and composition monitoring catches scale drift within hours instead of days. When a scale drifts by 0.5% over a week, the cumulative composition error by day 7 is significant — but daily operator checks at fixed intervals might miss the gradual shift.
Melting Furnace
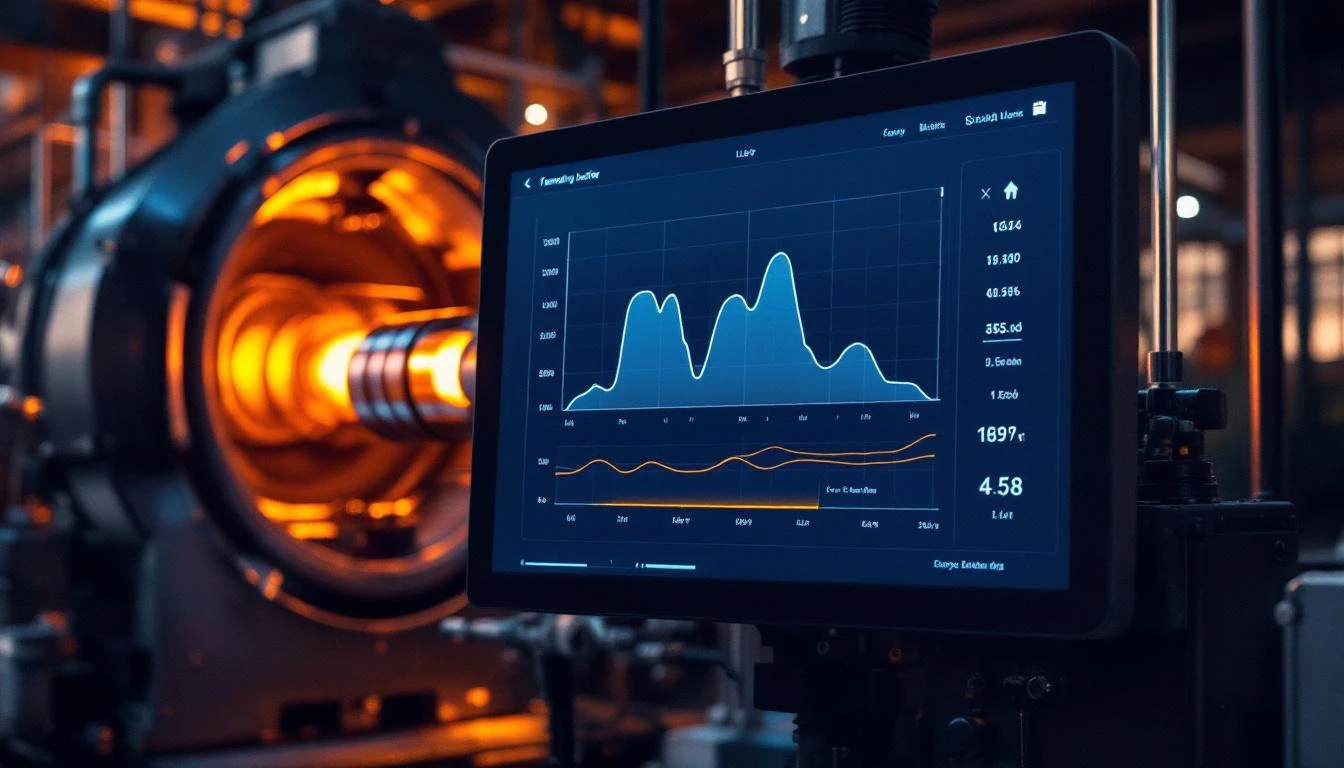
The furnace is the heart of glass manufacturing — and the most critical monitoring target. Modern glass furnaces are instrumented with 50-200+ measurement points, all of which should be continuously monitored:
Temperature mapping:
- Crown temperatures (above the glass) — 12-24 thermocouples across the furnace length
- Bottom temperatures — detecting refractory erosion or glass flow patterns
- Sidewall temperatures — external surface monitoring for hot spots indicating refractory thinning
- Regenerator/recuperator temperatures — heat recovery efficiency
- Flue gas temperatures — combustion efficiency and emissions control
Combustion monitoring:
- Gas flow rates per burner zone (typically 4-8 zones)
- Air-to-fuel ratio per zone — directly affects energy efficiency and glass quality
- Oxygen levels in the flue gas — indicates combustion completeness
- NOx and SOx emissions — regulatory compliance and combustion optimization
Electrical boost:
- Electrode current (amps) per electrode pair — indicates glass resistivity and temperature
- Electrode voltage — changes indicate electrode wear or glass composition shifts
- Power consumption (kW) — electric boost energy cost tracking
Glass level:
- Furnace glass level — critical for forming machine feed consistency
- Level trends — indicating throughput changes or pull rate adjustments
Refractory monitoring:
- External shell temperatures — mapped across the entire furnace surface
- Cooling system flow rates and temperatures — for water-cooled areas
- Thermocouple degradation — tracking sensor drift over months
Predictive maintenance applications:
Refractory wear modeling: By tracking external shell temperatures over months and years, IIoT systems can model refractory thickness at every point on the furnace. A gradual temperature increase at a specific location indicates the refractory is thinning — information that helps plan the furnace rebuild and identifies areas needing emergency patching.
Electrode life prediction: Electrode consumption rate varies with glass type, pull rate, and boost level. Continuous monitoring of electrode current and voltage, combined with historical consumption data, predicts when electrodes need advancing or replacing — preventing the catastrophic (and incredibly expensive) failure of a completely consumed electrode.
Regenerator efficiency tracking: Regenerator performance degrades over time as checker packing fouls with batch dust and sulfate deposits. Monitoring the temperature differential across the regenerator cycle quantifies efficiency loss and indicates when reversal schedules should change or when cleaning is needed.
Tin Bath (Float Glass Only)
Float glass manufacturing passes molten glass over a bath of molten tin to achieve optical-quality flatness. The tin bath is one of the most demanding monitoring environments:
- Tin temperature — multiple zones, ±1°C control required for thickness uniformity
- Glass ribbon temperature — determines ribbon viscosity and thickness
- Atmosphere composition — nitrogen/hydrogen ratio prevents tin oxidation
- Dew point — moisture control prevents tin oxide defects ("tin drip")
- Top roller positions and speeds — control ribbon width and thickness
- Ribbon speed — synchronized with the furnace pull rate and the annealing lehr
Quality impact: A 2°C temperature variation across the tin bath width can create 0.1mm thickness variation in the glass ribbon — enough to cause optical distortion in architectural or automotive glass. Only continuous, multi-point monitoring can maintain the precision required.
Forming Machines (Container Glass)
Container glass forming involves cutting molten glass gobs and pressing or blowing them into molds at rates of 100-500 bottles per minute per machine:
- Gob temperature — measured by IR pyrometer, affects forming and final strength
- Gob weight — measured by load cell, determines container capacity and wall thickness
- Mold temperatures — per section (typically 6-12 sections per machine)
- Forming air pressures — blow/counterblow pressures per section
- Cooling air flows — per mold
- Section timing — synchronized mechanical movements at high speed
- Ware temperature — at machine exit, before annealing
The section-by-section challenge: An IS (Individual Section) forming machine has 6-12 identical sections, each producing containers independently. A problem in Section 7 might produce defective ware for 20 minutes before an operator notices — that's 400-1,000 defective containers. IIoT monitoring with per-section parameter tracking and automatic comparison catches section deviations in seconds.
Annealing Lehr
After forming, glass must be slowly cooled (annealed) to relieve internal stresses. The annealing lehr maintains a precise temperature profile — typically from 550°C at entry to ambient at exit — over a distance of 30-100 meters.
Key monitoring parameters:
- Temperature profile — 10-20 zones along the lehr length
- Cross-profile temperature uniformity — edge-to-edge variation
- Belt speed — determines residence time at each temperature
- Burner/cooling performance — zone-by-zone energy input
- Ware temperature at exit — confirms annealing is complete
Why this matters: Under-annealed glass has residual stress that makes it prone to spontaneous breakage — a safety and liability nightmare for architectural and automotive applications. Over-annealing wastes energy and reduces throughput. The window is narrow, and it's defined entirely by the temperature profile in the lehr.
IIoT monitoring of the lehr temperature profile catches zone controller failures, blocked burners, and cooling system malfunctions within minutes — preventing hours of under-annealed or over-annealed production.
Cold End and Quality Inspection
Modern cold end inspection systems already generate massive amounts of data — dimensional measurements, stress analysis, defect detection, surface quality scoring. IIoT integration connects this quality data back to the process:
- Defect rates by type (bubbles, stones, cord, surface defects)
- Dimensional accuracy (weight, capacity, height, diameter, wall thickness)
- Stress levels (from polariscope or SCALP measurements)
- Pack rates — percentage of ware passing inspection
The feedback loop: When defect rates increase, the quality data alone tells you what changed. But correlated with upstream process data (furnace temperature, gob temperature, mold temperature, lehr profile), it tells you why — and often identifies the root cause before the quality engineers finish their first investigation.
Energy Optimization: The Biggest Financial Opportunity
Energy is the single largest controllable cost in glass manufacturing. For a typical container glass plant producing 300 tons per day:
- Natural gas cost: $4-8 million/year
- Electricity cost: $2-4 million/year
- Total energy cost: $6-12 million/year
IIoT-driven energy optimization targets:
Combustion optimization (2-5% savings): Continuously monitoring and adjusting air-to-fuel ratios per burner zone optimizes combustion efficiency. Most furnaces run slightly fuel-rich (for glass quality reasons) but often more fuel-rich than necessary. Tightening the ratio by 1-2% across all zones saves 2-5% of natural gas without affecting glass quality.
Electric boost optimization (3-8% savings): Shifting energy input between gas and electric boost based on real-time glass temperature distribution and utility pricing optimizes total energy cost. IIoT systems track the melting efficiency of gas vs. electric input and recommend the optimal split.
Regenerator performance management (1-3% savings): Tracking regenerator efficiency decline over time and optimizing reversal timing and cleaning schedules maintains heat recovery efficiency closer to design values.
Pull rate optimization (2-4% savings): Matching furnace pull rate to forming machine demand in real-time prevents over-melting during machine downtime (changeovers, machine maintenance, quality holds).
Total potential savings: 8-20% of energy cost = $500K-$2.4M/year for a 300 TPD container glass plant.
Getting Started in Glass Manufacturing
Glass plants contemplating IIoT adoption should start with the furnace — it's the highest-value asset and the highest-impact monitoring target:
Month 1: Connect the furnace control system to your IIoT platform. Most modern furnace controllers (B&W, Siemens, Allen-Bradley) expose data via Ethernet/IP or Modbus. Baseline furnace temperature profiles, energy consumption, and combustion parameters.
Month 2: Extend to the forming machines (container) or tin bath and lehr (float). Correlate forming/cooling parameters with quality inspection data.
Month 3: Build energy optimization models. Implement combustion tuning recommendations. Begin refractory wear trending.
With MachineCDN's 3-minute device setup and cellular connectivity, the IIoT infrastructure deploys without involving plant IT — which is critical in glass plants where the OT network controls safety-critical equipment and IT is (rightly) reluctant to approve new connections.
Ready to bring real-time intelligence to your glass operation? Book a demo to see how MachineCDN monitors furnaces, forming machines, and lehrs — with the continuous data capture that glass manufacturing demands.