
17 posts tagged with "ethernet-ip"

View All Tags

Allen-Bradley Micro800 EtherNet/IP Integration: A Practical Guide for Edge Connectivity [2026]

· 11 min read

Allen-Bradley Micro800 EtherNet/IP Edge Connectivity

The Allen-Bradley Micro800 series — particularly the Micro820, Micro830, and Micro850 — occupies a sweet spot in industrial automation. These compact PLCs deliver enough processing power for standalone machines while speaking EtherNet/IP natively. But connecting them to modern IIoT edge gateways reveals subtleties that trip up even experienced automation engineers.

This guide covers what you actually need to know: how CIP tag-based addressing works on Micro800s, how to configure element sizes and counts correctly, how to handle different data types, and how to avoid the pitfalls that turn a simple connectivity project into a week-long debugging session.

EtherNet/IP and CIP Objects Explained: Implicit vs Explicit Messaging for IIoT [2026]

· 12 min read

If you've spent any time integrating Allen-Bradley PLCs, Rockwell automation cells, or Micro800-class controllers into a modern IIoT stack, you've encountered EtherNet/IP. It's the most widely deployed industrial Ethernet protocol in North America, yet the specifics of how it actually moves data — CIP objects, implicit vs explicit messaging, the scanner/adapter relationship — remain poorly understood by many engineers who use it daily.

This guide breaks down EtherNet/IP from the perspective of someone who has built edge gateways that communicate with these controllers in production. No marketing fluff, just the protocol mechanics that matter when you're writing code that reads tags from a PLC at sub-second intervals.

EtherNet/IP CIP messaging architecture

What EtherNet/IP Actually Is (And Isn't)

EtherNet/IP stands for EtherNet/Industrial Protocol — not "Ethernet IP" as in TCP/IP. The "IP" is intentionally capitalized to distinguish it. At its core, EtherNet/IP is an application-layer protocol that runs CIP (Common Industrial Protocol) over standard TCP/IP and UDP/IP transport.

The key architectural insight: CIP is the protocol. EtherNet/IP is just one of its transport layers. CIP also runs over DeviceNet (CAN bus) and ControlNet (token-passing). This means the object model, service codes, and data semantics are identical whether you're talking to a device over Ethernet, a CAN network, or a deterministic control network.

For IIoT integration, this matters because your edge gateway's parsing logic for CIP objects translates directly across all three physical layers — even if 90% of modern deployments use EtherNet/IP exclusively.

The CIP Object Model

CIP organizes everything as objects. Every device on the network is modeled as a collection of object instances, each with attributes, services, and behaviors. Understanding this hierarchy is essential for programmatic tag access.

Object Addressing

Every piece of data in a CIP device is addressed by three coordinates:

LevelDescriptionExample
ClassThe type of objectClass 0x04 = Assembly Object
InstanceA specific occurrence of that classInstance 1 = Output assembly
AttributeA property of that instanceAttribute 3 = Data bytes

When your gateway creates a tag path like protocol=ab-eip&gateway=192.168.1.10&cpu=micro800&name=temperature_setpoint, the underlying CIP request resolves that symbolic tag name into a class/instance/attribute triplet.

Essential CIP Objects for IIoT

Here are the objects you'll interact with most frequently:

Identity Object (Class 0x01) — Every CIP device has one. Vendor ID, device type, serial number, product name. This is your first read when auto-discovering devices on a network. For fleet management, querying this object gives you hardware revision, firmware version, and a unique serial number that serves as a device fingerprint.

Message Router (Class 0x02) — Routes incoming requests to the correct object. You never address it directly, but understanding that it exists explains why a single TCP connection can multiplex requests to dozens of different objects without confusion.

Assembly Object (Class 0x04) — This is where I/O data lives. Assemblies aggregate multiple data points into a single, contiguous block. When you configure implicit messaging, you're essentially subscribing to an assembly object that the PLC updates at a fixed rate.

Connection Manager (Class 0x06) — Manages the lifecycle of connections. Forward Open, Forward Close, and Large Forward Open requests all go through this object. When your edge gateway opens a connection to read 50 tags, the Connection Manager allocates resources and returns a connection ID.

Implicit vs Explicit Messaging: The Critical Distinction

This is where most IIoT integration mistakes happen. EtherNet/IP supports two fundamentally different messaging paradigms, and choosing the wrong one leads to either wasted bandwidth or missed data.

Explicit Messaging (Request/Response)

Explicit messaging works like HTTP: your gateway sends a request, the PLC processes it, and sends a response. It uses TCP for reliability.

When to use explicit messaging:

  • Reading configuration parameters
  • Writing setpoints or recipe values
  • Querying device identity and diagnostics
  • Any operation where you need a guaranteed response
  • Tag reads at intervals > 100ms

The tag read flow:

Gateway                           PLC (Micro800)
| |
|--- TCP Connect (port 44818) -->|
|<-- TCP Accept ------------------|
| |
|--- Register Session ---------->|
|<-- Session Handle: 0x1A2B ----|
| |
|--- Read Tag Service ---------->|
| (class 0x6B, service 0x4C) |
| tag: "blender_speed" |
|<-- Response: FLOAT 1250.5 -----|
| |
|--- Read Tag Service ---------->|
| tag: "motor_current" |
|<-- Response: FLOAT 12.3 ------|

Each tag read is a separate CIP request encapsulated in a TCP packet. For reading dozens of tags, this adds up — each round trip includes TCP overhead, CIP encapsulation, and PLC processing time.

Performance characteristics:

  • Typical round-trip: 5–15ms per tag on a local network
  • 50 tags × 10ms = 500ms minimum cycle time
  • Connection timeout: typically 2000ms (configurable)
  • Maximum concurrent sessions: depends on PLC model (Micro800: ~8–16)

Implicit Messaging (I/O Data)

Implicit messaging is a scheduled, connectionless data exchange using UDP. The PLC pushes data at a fixed rate without being asked — think of it as a PLC-initiated publish.

When to use implicit messaging:

  • Continuous process monitoring (temperature, pressure, flow)
  • Motion control feedback
  • Any data that changes frequently (< 100ms intervals)
  • High tag counts where polling overhead is unacceptable

The connection flow:

Gateway                           PLC
| |
|--- Forward Open (TCP) ------->|
| RPI: 50ms |
| Connection type: Point-to-Point |
| O→T Assembly: Instance 100 |
| T→O Assembly: Instance 101 |
|<-- Forward Open Response ------|
| Connection ID: 0x4F2E |
| |
|<== I/O Data (UDP, every 50ms) =|
|<== I/O Data (UDP, every 50ms) =|
|<== I/O Data (UDP, every 50ms) =|
| ...continuous... |

The Requested Packet Interval (RPI) is specified in microseconds during the Forward Open. Common values:

  • 10ms (10,000 μs) — motion control
  • 50ms — process monitoring
  • 100ms — general I/O
  • 500ms–1000ms — slow-changing values (temperature, level)

Critical detail: The data format of implicit messages is defined by the assembly object, not by the message itself. Your gateway must know the assembly layout in advance — which bytes correspond to which tags, their data types, and byte ordering. There's no self-describing metadata in the UDP packets.

Scanner/Adapter Architecture

In EtherNet/IP terminology:

  • Scanner = the device that initiates connections and consumes data (your edge gateway, HMI, or supervisory PLC)
  • Adapter = the device that produces data (field I/O modules, drives, instruments)

A PLC can act as both: it's an adapter to the SCADA system above it, and a scanner to the I/O modules below it.

What This Means for IIoT Gateways

Your edge gateway is a scanner. When designing its communication stack, you need to handle:

  1. Session registration — Before any CIP communication, register a session with the target device. This returns a session handle that must be included in every subsequent request. Session handles are 32-bit integers; manage them carefully across reconnects.

  2. Connection management — For explicit messaging, a single TCP connection can carry multiple CIP requests. For implicit messaging, each connection requires a Forward Open with specific parameters. Plan your connection budget — Micro800 controllers support 8–16 simultaneous connections depending on firmware.

  3. Tag path resolution — Symbolic tag names (like B3_0_0_blender_st_INT) must be resolved to CIP paths. For Micro800 controllers, the tag path format is:

    protocol=ab-eip&gateway=<ip>&cpu=micro800&elem_count=<n>&elem_size=<s>&name=<tagname>

    Where elem_size is 1 (bool/int8), 2 (int16), or 4 (int32/float).

  4. Array handling — CIP supports reading arrays with a start index and element count. A single request can read up to 255 elements. For arrays, the tag path includes the index: tagname[start_index].

Data Types and Byte Ordering

CIP uses little-endian byte ordering for all integer types, which is native to x86-based controllers. However, when tag values arrive at your gateway, the handling depends on the data type:

CIP TypeSizeByte OrderNotes
BOOL1 byteN/A0x00=false, 0x01=true
INT8 / USINT1 byteN/ASigned: -128 to 127
INT16 / INT2 bytesLittle-endian-32,768 to 32,767
INT32 / DINT4 bytesLittle-endianIndexed at offset × 4
UINT16 / UINT2 bytesLittle-endian0 to 65,535
UINT32 / UDINT4 bytesLittle-endianIndexed at offset × 4
REAL / FLOAT4 bytesIEEE 754Indexed at offset × 4

A common gotcha: When reading 32-bit values, the element offset in the response buffer is index × 4 bytes from the start. For 16-bit values, it's index × 2. Getting this wrong silently produces garbage values that look plausible — a classic source of phantom sensor readings.

Practical Integration Pattern: Interval-Based Tag Reading

In production IIoT deployments, not every tag needs to be read at the same rate. A blender's running status might change once per shift, while a motor current needs 1-second resolution. A well-designed gateway implements per-tag interval scheduling:

Tag Configuration:
- blender_status: type=bool, interval=60s, compare=true
- motor_speed: type=float, interval=5s, compare=false
- temperature_sp: type=float, interval=10s, compare=true
- alarm_word: type=uint16, interval=1s, compare=true

The compare flag is crucial for bandwidth optimization. When enabled, the gateway only forwards a value to the cloud if it has changed since the last read. For boolean status tags that might stay constant for hours, this eliminates 99%+ of redundant transmissions.

Dependent Tag Chains

Some tags are only meaningful when a parent tag changes. For example, when a machine_state tag transitions from IDLE to RUNNING, you want to immediately read a cascade of operational tags (speed, temperature, pressure) regardless of their normal intervals.

This pattern — triggered reads on value change — dramatically reduces average bandwidth while ensuring you never miss the data that matters. The gateway maintains a dependency graph where certain tags trigger force-reads of their children.

Handling Connection Failures

EtherNet/IP connections fail. PLCs reboot. Network switches drop packets. A production-grade gateway implements:

  1. Retry with backoff — On read failure (typically error code -32 for connection timeout), retry up to 3 times before declaring the link down.
  2. Link state tracking — Maintain a boolean link state per device. Transition to DOWN on persistent failures; transition to UP on the first successful read. Deliver link state changes immediately (not batched) as they're high-priority events.
  3. Automatic reconnection — On link DOWN, destroy the existing connection context and attempt to re-establish. Don't just retry on the dead socket.
  4. Hourly forced reads — Even when using compare-based transmission, periodically force-read and deliver all tags. This prevents state drift where the gateway and cloud have different views of a value that changed during a brief disconnection.

Batching for MQTT Delivery

The gateway doesn't forward each tag value individually to the cloud. Instead, it implements a batch-and-forward pattern:

  1. Start a batch group with a timestamp
  2. Accumulate tag values (with ID, status, type, and value data)
  3. Close the group when either:
    • The batch size exceeds the configured maximum (typically 4KB)
    • The collection timeout expires (typically 60 seconds)
  4. Serialize the batch (JSON or binary) and push to an output buffer
  5. The output buffer handles MQTT QoS 1 delivery with page-based flow control

Binary serialization is preferred for bandwidth-constrained cellular connections. A typical binary batch frame:

Header:  0xF7 (command byte)
4 bytes: number of groups
Per group:
4 bytes: timestamp
2 bytes: device type
4 bytes: serial number
4 bytes: number of values
Per value:
2 bytes: tag ID
1 byte: status (0x00 = OK)
1 byte: array size
1 byte: element size (1, 2, or 4)
N bytes: packed data (MSB → LSB)

This binary format achieves roughly 3–5x compression over equivalent JSON, which matters when you're paying per-megabyte on cellular or satellite links.

Performance Benchmarks

Based on production deployments with Micro800 controllers:

ScenarioTagsCycle TimeBandwidth
All explicit, 1s interval50~800ms~2KB/s JSON
All explicit, 5s interval100~1200ms~1KB/s JSON
Mixed interval + compare100Varies~200B/s binary
Implicit I/O, 50ms RPI2050ms fixed~4KB/s

The "mixed interval + compare" row shows the power of intelligent scheduling — by reading fast-changing tags frequently and slow-changing tags infrequently, and only forwarding values that actually changed, you can monitor 100+ tags with less bandwidth than 20 tags on implicit I/O.

Common Pitfalls

1. Exhausting connection slots. Each Forward Open consumes a connection slot on the PLC. Open too many and you'll get "Connection Refused" errors. Pool your connections and reuse sessions.

2. Mismatched element sizes. If you request elem_size=4 but the tag is actually INT16, you'll read adjacent memory and get corrupted values. Always match element size to the tag's actual data type.

3. Ignoring the simulator trap. When testing with a PLC simulator, random values mask real issues like byte-ordering bugs and timeout handling. Test against real hardware before deploying.

4. Not handling -32 errors. Error code -32 from libplctag means "connection failed." Three consecutive -32s should trigger a full disconnect/reconnect cycle, not just a retry on the same broken connection.

5. Blocking on tag creation. Creating a tag handle (plc_tag_create) can block for the full timeout duration if the PLC is unreachable. Use appropriate timeouts (2000ms is a reasonable default) and handle negative return values.

How machineCDN Handles EtherNet/IP

machineCDN's edge gateway natively supports EtherNet/IP with the patterns described above: per-tag intervals, compare-based change detection, dependent tag chains, binary batch serialization, and store-and-forward buffering. When you connect a Micro800 or CompactLogix controller, the gateway auto-detects the protocol, reads device identity, and begins scheduled tag acquisition — no manual configuration of CIP class/instance/attribute paths required.

The platform handles the complexity of connection management, retry logic, and bandwidth optimization so your engineering team can focus on the data rather than the protocol plumbing.

Conclusion

EtherNet/IP is more than "Modbus over Ethernet." Its CIP object model provides a rich, typed, hierarchical data architecture. Understanding the difference between implicit and explicit messaging — and knowing when to use each — is the difference between a gateway that polls itself to death and one that efficiently scales to hundreds of tags across dozens of controllers.

The key takeaways:

  • Use explicit messaging for configuration reads and tags with intervals > 100ms
  • Use implicit messaging for high-frequency process data
  • Implement per-tag intervals with compare flags to minimize bandwidth
  • Design for failure with retry logic, link state tracking, and periodic forced reads
  • Batch before sending — never forward individual tag values to the cloud

Master these patterns and you'll build IIoT integrations that run reliably for years, not demos that break in production.

Best PLC Data Collection Software 2026: 10 Platforms for Extracting Value from Your Controllers

· 10 min read
MachineCDN Team
Industrial IoT Experts

Your PLCs already know everything about your manufacturing operation — cycle times, temperatures, pressures, motor speeds, part counts, alarm states. The problem isn't data. It's getting that data out of the PLC and into a place where humans and AI can actually use it. PLC data collection software bridges that gap, and choosing the right platform determines whether you get actionable intelligence or just another data silo.

DeviceNet to EtherNet/IP Migration: A Practical Guide for Modernizing Legacy CIP Networks [2026]

· 14 min read

DeviceNet isn't dead — it's still running in thousands of manufacturing plants worldwide. But if you're maintaining a DeviceNet installation in 2026, you're living on borrowed time. Parts are getting harder to find. New devices are EtherNet/IP-only. Your IIoT platform can't natively speak CAN bus. And the engineers who understand DeviceNet's quirks are retiring.

The good news: DeviceNet and EtherNet/IP share the same application layer — the Common Industrial Protocol (CIP). That means migration isn't a complete rearchitecture. It's more like upgrading the transport while keeping the logic intact.

The bad news: the differences between a CAN-based serial bus and modern TCP/IP Ethernet are substantial, and the migration is full of subtle gotchas that can turn a weekend project into a month-long nightmare.

This guide covers what actually changes, what stays the same, and how to execute the migration without shutting down your production line.

Why Migrate Now

The Parts Clock Is Ticking

DeviceNet uses CAN (Controller Area Network) at the physical layer — the same bus technology from automotive. DeviceNet taps, trunk cables, terminators, and CAN-specific interface cards are all becoming specialty items. Allen-Bradley 1756-DNB DeviceNet scanners cost 2-3x what they did five years ago on the secondary market.

EtherNet/IP uses standard Ethernet infrastructure. Cat 5e/6 cable, commodity switches, and off-the-shelf NICs. You can buy replacement parts at any IT supplier.

IIoT Demands Ethernet

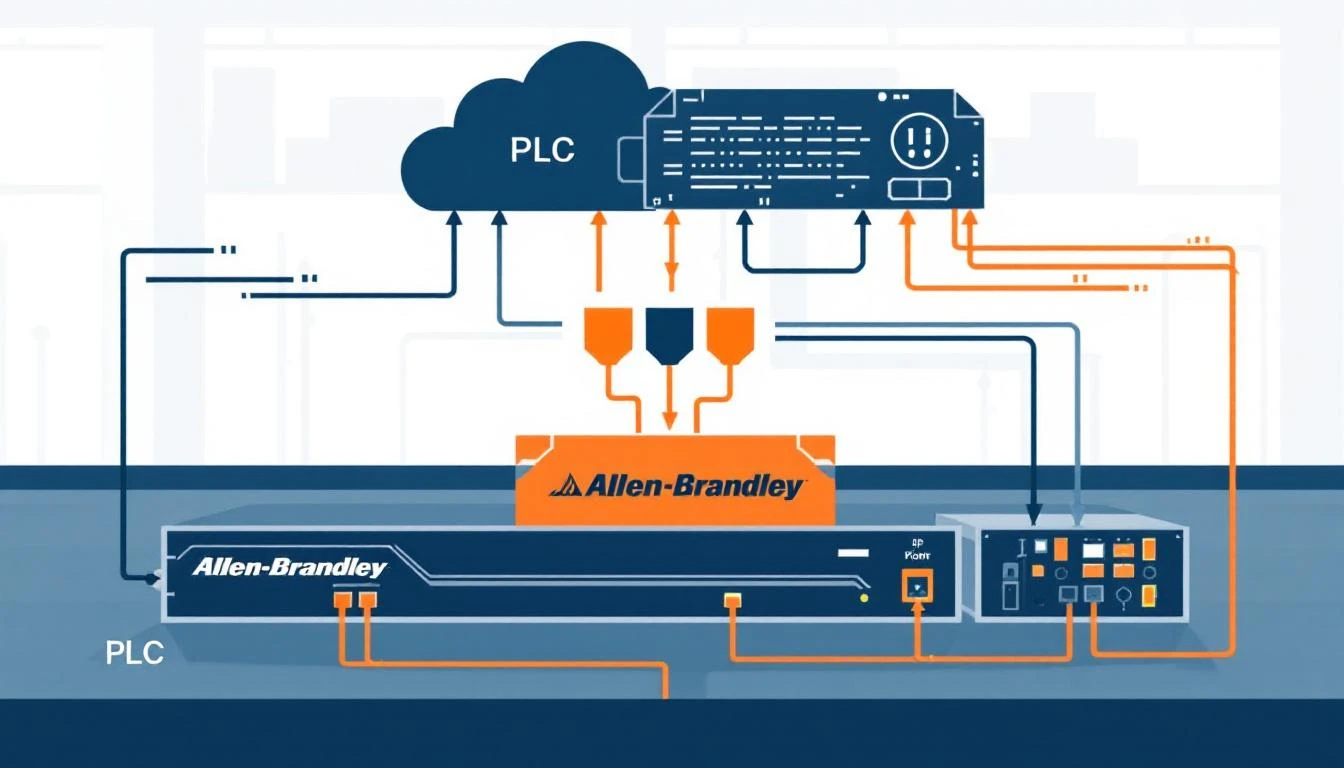
Modern IIoT platforms connect to PLCs via EtherNet/IP (CIP explicit messaging), Modbus TCP, or OPC-UA — all Ethernet-based protocols. Connecting to DeviceNet requires a protocol converter or a dedicated scanner module, adding cost and complexity.

When an edge gateway reads tags from an EtherNet/IP-connected PLC, it speaks CIP directly over TCP/IP. The tag path, element count, and data types map cleanly to standard read operations. With DeviceNet, there's an additional translation layer — the gateway must talk to the DeviceNet scanner module, which then mediates communication to the DeviceNet devices.

Eliminating that layer means faster polling, simpler configuration, and fewer failure points.

Bandwidth Limitations

DeviceNet runs at 125, 250, or 500 kbps — kilobits, not megabits. For simple discrete I/O (24 photoelectric sensors and a few solenoid valves), this is fine. But modern manufacturing cells generate far more data:

  • Servo drive diagnostics
  • Process variable trends
  • Vision system results
  • Safety system status words
  • Energy monitoring data

A single EtherNet/IP connection runs at 100 Mbps minimum (1 Gbps typical) — that's 200-8,000x more bandwidth. The difference isn't just theoretical: it means you can read every tag at full speed without bus contention errors.

What Stays the Same: CIP

The Common Industrial Protocol is protocol-agnostic. CIP defines objects (Identity, Connection Manager, Assembly), services (Get Attribute Single, Set Attribute, Forward Open), and data types independently of the transport layer.

This is DeviceNet's salvation — and yours. A CIP Assembly object that maps 32 bytes of I/O data works identically whether the transport is:

  • DeviceNet (CAN frames, MAC IDs, fragmented messaging)
  • EtherNet/IP (TCP/IP encapsulation, IP addresses, implicit I/O connections)
  • ControlNet (scheduled tokens, node addresses)

Your PLC program doesn't care how the Assembly data arrives. The I/O mapping is the same. The tag names are the same. The data types are the same.

Practical Implication

If you're running a Micro850 or CompactLogix PLC with DeviceNet I/O modules, migrating to EtherNet/IP I/O modules means:

  1. PLC logic stays unchanged (mostly — more on this later)
  2. Assembly instances map directly (same input/output sizes)
  3. CIP services work identically (Get Attribute, Set Attribute, explicit messaging)
  4. Data types are preserved (BOOL, INT, DINT, REAL — same encoding)

What changes is the configuration: MAC IDs become IP addresses, DeviceNet scanner modules become EtherNet/IP adapter ports, and CAN trunk cables become Ethernet switches.

What Changes: The Deep Differences

Addressing: MAC IDs vs. IP Addresses

DeviceNet uses 6-bit MAC IDs (0-63) set via physical rotary switches or software. Each device on the bus has a unique MAC ID, and the scanner references devices by this number.

EtherNet/IP uses standard IP addressing. Devices get addresses via DHCP, BOOTP, or static configuration. The scanner references devices by IP address and optionally by hostname.

Migration tip: Create an address mapping spreadsheet before you start:

DeviceNet MAC ID → EtherNet/IP IP Address
━━━━━━━━━━━━━━━━━━━━━━━━━━━━━━━━━━━━━━
MAC 01 (Motor Starter #1) → 192.168.1.101
MAC 02 (Photoelectric Bank) → 192.168.1.102
MAC 03 (Valve Manifold) → 192.168.1.103
MAC 10 (VFD Panel A) → 192.168.1.110
MAC 11 (VFD Panel B) → 192.168.1.111

Use the last two octets of the IP address to mirror the old MAC ID where possible. Maintenance technicians who know "MAC 10 is the VFD panel" will intuitively map to 192.168.1.110.

Communication Model: Polled I/O vs. Implicit Messaging

DeviceNet primarily uses polled I/O or change-of-state messaging. The scanner sends a poll request to each device, and the device responds with its current data. This is sequential — device 1, then device 2, then device 3, and so on.

EtherNet/IP uses implicit (I/O) messaging with Requested Packet Interval (RPI). The scanner opens a CIP connection to each adapter, and data flows at a configured rate (typically 5-100ms) using UDP multicast. All connections run simultaneously — no sequential polling.

DeviceNet (Sequential):
Scanner → Poll MAC01 → Response → Poll MAC02 → Response → ...
Total cycle = Sum of all individual transactions

EtherNet/IP (Parallel):
Scanner ──┬── Connection to 192.168.1.101 (RPI 10ms)
├── Connection to 192.168.1.102 (RPI 10ms)
├── Connection to 192.168.1.103 (RPI 10ms)
└── Connection to 192.168.1.110 (RPI 20ms)
Total cycle = Max(individual RPIs) = 20ms

Performance impact: A DeviceNet bus with 20 devices at 500kbps might have a scan cycle of 15-30ms. The same 20 devices on EtherNet/IP can all run at 10ms RPI simultaneously, with room to spare. Your control loop gets faster, not just your bandwidth.

Error Handling: Bus Errors vs. Connection Timeouts

DeviceNet has explicit error modes tied to the CAN bus: bus-off, error passive, CAN frame errors. When a device misses too many polls, it goes into a "timed out" state. The scanner reports which MAC ID failed.

EtherNet/IP uses TCP connection timeouts and UDP heartbeats. If an implicit I/O connection misses 4x its RPI without receiving data, the connection times out. The error reporting is more granular — you can distinguish between "device unreachable" (ARP failure), "connection refused" (CIP rejection), and "data timeout" (UDP loss).

Important: DeviceNet's error behavior is synchronous with the bus scan. When a device fails, you know immediately on the next scan cycle. EtherNet/IP's timeout behavior is asynchronous — a connection can be timing out while others continue normally. Your fault-handling logic may need adjustment to handle this differently.

Wiring and Topology

DeviceNet is a bus topology with a single trunk line. All devices tap into the same cable. Maximum trunk length depends on baud rate:

  • 500 kbps: 100m trunk
  • 250 kbps: 250m trunk
  • 125 kbps: 500m trunk

Drop cables from trunk to device are limited to 6m. Total combined drop length has a bus-wide limit (156m at 125 kbps).

EtherNet/IP is a star topology. Each device connects to a switch port via its own cable (up to 100m per run for copper, kilometers for fiber). No trunk length limits, no drop length limits, no shared-bus contention.

Migration implication: You can't just swap cables. DeviceNet trunk cables are typically 18 AWG with integrated power (24V bus power). Ethernet uses Cat 5e/6 without power. If your DeviceNet devices were bus-powered, you'll need separate 24V power runs to each device location, or use PoE (Power over Ethernet) switches.

Migration Strategy: The Three Approaches

Replace everything at once during a planned shutdown. Remove all DeviceNet hardware, install EtherNet/IP modules, reconfigure the PLC, test, and restart.

Pros: Clean cutover, no mixed-network complexity. Cons: If anything goes wrong, your entire line is down. Testing time is limited to the shutdown window. Very high risk.

2. Parallel Run with Protocol Bridge

Install a DeviceNet-to-EtherNet/IP protocol bridge (like ProSoft MVI69-DFNT or HMS Anybus). Keep the DeviceNet bus running while you add EtherNet/IP connectivity.

PLC ──── EtherNet/IP ──── Protocol Bridge ──── DeviceNet Bus

IIoT Edge Gateway
(native EtherNet/IP access)

Pros: Zero downtime, gradual migration, IIoT connectivity immediately. Cons: Protocol bridge adds latency (~5-10ms), cost ($500-2000 per bridge), another device to maintain. Assembly mapping through the bridge can be tricky.

Replace DeviceNet devices one at a time (or one machine cell at a time) with EtherNet/IP equivalents. The PLC runs both a DeviceNet scanner and an EtherNet/IP adapter simultaneously during the transition.

Most modern PLCs (CompactLogix, ControlLogix) support both. The DeviceNet scanner module (1756-DNB or 1769-SDN) stays in the rack alongside the Ethernet port. As devices are migrated, their I/O is remapped from the DeviceNet scanner tree to the EtherNet/IP I/O tree.

Migration sequence per device:

  1. Order the EtherNet/IP equivalent of the DeviceNet device
  2. Pre-configure IP address, Assembly instances, RPI
  3. During a micro-stop (shift change, lunch break):
    • Disconnect DeviceNet device
    • Install EtherNet/IP device + Ethernet cable
    • Remap I/O tags in PLC from DeviceNet scanner to EtherNet/IP adapter
    • Test
  4. Remove old DeviceNet device

Typical timeline: 15-30 minutes per device. A 20-device network can be migrated over 2-3 weeks of micro-stops.

PLC Program Changes

Tag Remapping

The biggest PLC-side change is tag paths. DeviceNet I/O tags reference the scanner module and MAC ID:

DeviceNet:
Local:1:I.Data[0] (Scanner in slot 1, input word 0)

EtherNet/IP I/O tags reference the connection by IP:

EtherNet/IP:
Valve_Manifold:I.Data[0] (Named connection, input word 0)

Best practice: Use aliased tags in your PLC program. If your rungs reference Motor_1_Running (alias of Local:1:I.Data[0].2), you only need to change the alias target — not every rung that uses it. If your rungs directly reference the I/O path... you have more work to do.

RPI Tuning

DeviceNet scan rates are managed at the bus level. EtherNet/IP lets you set RPI per connection. Start with:

  • Discrete I/O (photoelectrics, solenoids): 10-20ms RPI
  • Analog I/O (temperatures, pressures): 50-100ms RPI
  • VFDs (speed/torque data): 20-50ms RPI
  • Safety I/O (CIP Safety): 10-20ms RPI (match safety PFD requirements)

Don't over-poll. Setting everything to 2ms RPI because you can will create unnecessary network load and CPU consumption. Match the RPI to the actual process dynamics.

Connection Limits

DeviceNet scanners support 63 devices (MAC ID limit). EtherNet/IP has no inherent device limit, but each PLC has a connection limit — typically 128-256 CIP connections depending on the controller model.

Each EtherNet/IP I/O device uses at least one connection. Devices with multiple I/O assemblies (e.g., separate safety and standard I/O) use multiple connections. Monitor your controller's connection count during migration.

IIoT Benefits After Migration

Once your devices are on EtherNet/IP, your IIoT edge gateway can access them directly via CIP explicit messaging — no protocol converters needed.

The gateway opens CIP connections to each device, reads tags at configurable intervals, and publishes the data to MQTT or another cloud transport. This is how platforms like machineCDN operate: they speak native EtherNet/IP (and Modbus TCP) to the devices, handling type conversion, batch aggregation, and store-and-forward for cloud delivery.

What this enables:

  • Direct device diagnostics: Read CIP identity objects (vendor ID, product name, firmware version) from every device on the network. No more walking the floor with a DeviceNet configurator.
  • Process data at full speed: Read servo drive status, VFD parameters, and temperature controllers at 1-2 second intervals without bus contention.
  • Predictive maintenance signals: Vibration data, motor current, bearing temperature — all available over EtherNet/IP from modern drives.
  • Remote troubleshooting: An engineer can read device parameters from anywhere on the plant network (or through VPN) without physically connecting to a DeviceNet bus.

Tag Reads After Migration

With EtherNet/IP, the edge gateway connects using CIP's ab-eip protocol to read tags by name:

Protocol: EtherNet/IP (CIP)
Gateway: 192.168.1.100 (PLC IP)
CPU: Micro850
Tag: barrel_temp_zone_1
Type: REAL (float32)

The gateway reads the tag value, applies type conversion (the PLC stores IEEE 754 floats natively, so no Modbus byte-swapping gymnastics), and delivers it to the cloud. Compared to reading the same value through a DeviceNet scanner's polled I/O words — where you'd need to know which word offset maps to which variable — named tags are dramatically simpler.

Network Design for EtherNet/IP

Switch Selection

Use managed industrial Ethernet switches, not consumer/office switches. Key features:

  • IGMP snooping: EtherNet/IP uses UDP multicast for implicit I/O. Without IGMP snooping, multicast traffic floods every port.
  • QoS/DiffServ: Prioritize CIP I/O traffic (DSCP 47/55) over best-effort traffic.
  • Port mirroring: Essential for troubleshooting with Wireshark.
  • DIN-rail mounting: Because this is going in an industrial panel, not a server room.
  • Extended temperature range: -10°C to 60°C minimum for factory environments.

VLAN Segmentation

Separate your EtherNet/IP I/O traffic from IT/IIoT traffic using VLANs:

VLAN 10: Control I/O (PLC ↔ I/O modules, drives)
VLAN 20: HMI/SCADA (operator stations)
VLAN 30: IIoT/Cloud (edge gateways, MQTT)
VLAN 99: Management (switch configuration)

The edge gateway lives on VLAN 30 with a routed path to VLAN 10 for CIP reads. This ensures IIoT traffic can never interfere with control I/O at the switch level.

Ring Topology for Redundancy

DeviceNet is a bus — one cable break takes down everything downstream. EtherNet/IP with DLR (Device Level Ring) or RSTP (Rapid Spanning Tree) provides sub-second failover. A single cable cut triggers a topology change, and traffic reroutes automatically.

Most Allen-Bradley EtherNet/IP modules support DLR natively. Third-party devices may require an external DLR-capable switch.

Common Migration Mistakes

1. Forgetting Bus Power

DeviceNet provides 24V bus power on the trunk cable. Many DeviceNet devices (especially compact I/O blocks) draw power from the bus and have no separate power terminals. When you remove the DeviceNet trunk, those devices need a dedicated 24V supply.

Check every device's power requirements before migration. This is the most commonly overlooked issue.

2. IP Address Conflicts

DeviceNet MAC IDs are set physically — you can see them. IP addresses are invisible. Two devices with the same IP will cause intermittent communication failures that are incredibly difficult to diagnose.

Reserve a dedicated subnet for EtherNet/IP I/O (e.g., 192.168.1.0/24) and maintain a strict IP allocation spreadsheet. Use DHCP reservations or BOOTP if your devices support it.

3. Not Testing Failover Behavior

DeviceNet and EtherNet/IP handle device failures differently. Your PLC program may assume DeviceNet-style fault behavior (synchronous, bus-wide notification). EtherNet/IP faults are per-connection and asynchronous.

Test every failure mode: device power loss, cable disconnection, switch failure. Verify that your fault-handling rungs respond correctly.

4. Ignoring Firmware Compatibility

EtherNet/IP devices from the same vendor may have different Assembly instance mappings across firmware versions. The device you tested in the lab may behave differently from the one installed on the floor if the firmware versions don't match.

Document firmware versions and maintain spare devices with matching firmware.

Timeline and Budget

For a typical migration of a 20-device DeviceNet network:

ItemEstimated Cost
EtherNet/IP equivalent devices (20 units)$8,000-15,000
Industrial Ethernet switches (2-3 managed)$1,500-3,000
Cat 6 cabling and patch panels$500-1,500
Engineering time (40-60 hours)$4,000-9,000
Commissioning and testing$2,000-4,000
Total$16,000-32,500

Timeline: 2-4 weeks with rolling migration approach, including engineering prep, device installation, and testing. The line can continue running throughout.

Compare this to the alternative: maintaining a DeviceNet network with $800 replacement scanner modules, 4-week lead times on DeviceNet I/O blocks, and no IIoT connectivity. The migration pays for itself in reduced maintenance costs and operational visibility within 12-18 months.

Conclusion

DeviceNet to EtherNet/IP migration is not a question of if — it's a question of when. The CIP application layer makes it far less painful than migrating between incompatible protocols. Your PLC logic stays intact, your I/O mappings transfer directly, and you gain immediate benefits in bandwidth, diagnostic capability, and IIoT readiness.

Start with a network audit. Map every device, its MAC ID, its I/O configuration, and its power requirements. Then execute a rolling migration — one device at a time, one micro-stop at a time — until the last DeviceNet tap is removed.

Your reward: a modern Ethernet infrastructure that speaks the same CIP language, runs 1,000x faster, and connects directly to every IIoT platform on the market.

Edge Gateway Lifecycle Architecture: From Boot to Steady-State Telemetry in Industrial IoT [2026]

· 14 min read

Most IIoT content treats the edge gateway as a black box: PLC data goes in, cloud data comes out. That's fine for a sales deck. It's useless for the engineer who needs to understand why their gateway loses data during a network flap, or why configuration changes require a full restart, or why it takes 90 seconds after boot before the first telemetry packet reaches the cloud.

This article breaks down the complete lifecycle of a production industrial edge gateway — from the moment it powers on to steady-state telemetry delivery, including every decision point, failure mode, and recovery mechanism in between. These patterns are drawn from real-world gateways running on resource-constrained hardware (64MB RAM, MIPS processors) in plastics manufacturing plants, monitoring TCUs, chillers, blenders, and dryers 24/7.

Phase 1: Boot and Configuration Load

When a gateway boots (or restarts after a configuration change), the first task is loading its configuration. In production deployments, there are typically two configuration layers:

The Daemon Configuration

This is the central configuration that defines what equipment to talk to:

{
"plc": {
"ip": "192.168.5.5",
"modbus_tcp_port": 502
},
"serial_device": {
"port": "/dev/rs232",
"baud": 9600,
"parity": "none",
"data_bits": 8,
"stop_bits": 1,
"byte_timeout_ms": 4,
"response_timeout_ms": 100
},
"batch_size": 4000,
"batch_timeout_sec": 60,
"startup_delay_sec": 30
}

The startup delay is a critical design choice. When a gateway boots simultaneously with the PLCs it monitors (common after a power outage), the PLCs may need 10-30 seconds to initialize their communication stacks. If the gateway immediately tries to connect, it fails, marks the PLC as unreachable, and enters a slow retry loop. A 30-second startup delay avoids this race condition.

The serial link parameters (baud, parity, data bits, stop bits) must match the PLC exactly. A mismatch here produces zero error feedback — you just get silence. The byte timeout (time between consecutive bytes) and response timeout (time to wait for a complete response) are tuned per equipment type. TCUs with slower processors may need 100ms+ response timeouts; modern PLCs respond in 10-20ms.

The Device Configuration Files

Each equipment type gets its own configuration file that defines which registers to read, what data types to expect, and how often to poll. These files are loaded dynamically based on the device type detected during the discovery phase.

A real device configuration for a batch blender might define 40+ tags, each with:

  • A unique tag ID (1-32767)
  • The Modbus register address or EtherNet/IP tag name
  • Data type (bool, int8, uint8, int16, uint16, int32, uint32, float)
  • Element count (1 for scalars, 2+ for arrays or multi-register values)
  • Poll interval in seconds
  • Whether to compare with previous value (change-based delivery)
  • Whether to send immediately or batch with other values

Hot-reload capability is essential for production systems. The gateway should monitor configuration file timestamps and automatically detect changes. When a configuration file is modified (pushed via MQTT from the cloud, or copied via SSH during maintenance), the gateway reloads it without requiring a full restart. This means configuration updates can be deployed remotely to gateways in the field without disrupting data collection.

Phase 2: Device Detection

After configuration loads successfully, the gateway enters the device detection phase. This is where protocol-level intelligence matters.

Multi-Protocol Discovery

A well-designed gateway doesn't assume which protocol the PLC speaks. Instead, it tries multiple protocols in order of preference:

Step 1: Try EtherNet/IP

The gateway sends a CIP (Common Industrial Protocol) request to the configured IP address, attempting to read a device_type tag. EtherNet/IP uses the ab-eip protocol with a micro800 CPU profile (for Allen-Bradley Micro8xx series). If the PLC responds with a valid device type, the gateway knows this is an EtherNet/IP device.

Connection path: protocol=ab-eip, gateway=192.168.5.5, cpu=micro800
Target tag: device_type (uint16)
Timeout: 2000ms

Step 2: Fall back to Modbus TCP

If EtherNet/IP fails (error code -32 = "no connection"), the gateway tries Modbus TCP on port 502. It reads input register 800 (address 300800) which, by convention, stores the device type identifier.

Function code: 4 (Read Input Registers)
Register: 800
Count: 1
Expected: uint16 device type code

Step 3: Serial detection for Modbus RTU

If TCP protocols fail, the gateway probes the serial port for Modbus RTU devices. RTU detection is trickier because there's no auto-discovery mechanism — you must know the slave address. Production gateways typically configure a default address (slave ID 1) and attempt a read.

Serial Number Extraction

After identifying the device type, the gateway reads the equipment's serial number. This is critical for fleet management — each physical machine needs a unique identifier for cloud-side tracking.

Different equipment types store serial numbers in different registers:

Equipment TypeProtocolMonth RegisterYear RegisterUnit Register
Portable ChillerModbus TCPInput 22Input 23Input 24
Central ChillerModbus TCPHolding 520Holding 510Holding 500
TCUModbus RTUEtherNet/IPEtherNet/IPEtherNet/IP
Batch BlenderEtherNet/IPCIP tagCIP tagCIP tag

The serial number is packed into a 32-bit value:

Byte 3: Year  (0x40=2010, 0x41=2011, ...)
Byte 2: Month (0x00=Jan, 0x01=Feb, ...)
Bytes 0-1: Unit number (sequential)

Example: 0x002A0050 = January 2010, unit #80

Fallback serial generation: If the PLC doesn't have a programmed serial number (common with newly installed equipment), the gateway generates one using the router's serial number as a seed, with a prefix byte distinguishing PLCs (0x7F) from TCUs (0x7E). This ensures every device in the fleet has a unique identifier even before the serial number is programmed.

Configuration Loading by Device Type

Once the device type is known, the gateway searches for a matching configuration file. If type 1010 is detected, it loads the batch blender configuration. If type 5000, it loads the TCU configuration. If no matching configuration exists, the gateway logs an error and continues monitoring other ports.

This pattern — detect → identify → configure — means a single gateway binary handles dozens of equipment types. Adding support for a new machine is a configuration file change, not a firmware update.

With devices detected and configured, the gateway establishes its cloud connection via MQTT.

Connection Architecture

Production IIoT gateways use MQTT 3.1.1 over TLS (port 8883) for cloud connectivity. The connection setup involves:

  1. Certificate verification — the gateway validates the cloud broker's certificate against a CA root cert stored locally
  2. SAS token authentication — using a device-specific Shared Access Signature that encodes the hostname, device ID, and expiration timestamp
  3. Topic subscription — after connecting, the gateway subscribes to its command topic for receiving configuration updates and control commands from the cloud
Publish topic:  devices/{deviceId}/messages/events/
Subscribe topic: devices/{deviceId}/messages/devicebound/#
QoS: 1 (at least once delivery)

QoS 1 is the standard choice for industrial telemetry — it guarantees message delivery while avoiding the overhead and complexity of QoS 2 (exactly once). Since the data pipeline is designed to handle duplicates (via timestamp deduplication at the cloud layer), QoS 1 provides the right balance of reliability and performance.

The Async Connection Thread

MQTT connection can take 5-30 seconds depending on network conditions, DNS resolution, and TLS handshake time. A naive implementation blocks the main loop during connection, which means no PLC data is read during this time.

The solution: run mosquitto_connect_async() in a separate thread. The main loop continues reading PLC tags and buffering data while the MQTT connection establishes in the background. Once the connection callback fires, buffered data starts flowing to the cloud.

This is implemented using a semaphore-based producer-consumer pattern:

  1. Main thread prepares connection parameters and posts to a semaphore
  2. Connection thread wakes up, calls connect_async(), and signals completion
  3. Main thread checks semaphore state before attempting reconnection (prevents double-connect)

Connection Watchdog

Network connections fail. Cell modems lose signal. Cloud brokers restart. A production gateway needs a watchdog that detects stale connections and forces reconnection.

The watchdog pattern:

Every 120 seconds:
1. Check: have we received ANY confirmation from the broker?
(delivery ACK, PUBACK, SUBACK — anything)
2. If yes → connection is healthy, reset watchdog timer
3. If no → connection is stale. Destroy MQTT client and reinitiate.

The 120-second timeout is tuned for cellular networks where intermittent connectivity is expected. On wired Ethernet, you could reduce this to 30-60 seconds. The key insight: don't just check "is the TCP socket open?" — check "has the broker confirmed any data delivery recently?" A half-open socket can persist for hours without either side knowing.

Phase 4: Steady-State Tag Reading

Once PLC connections and MQTT are established, the gateway enters its main polling loop. This is where it spends 99.9% of its runtime.

The Main Loop (1-second resolution)

The core loop runs every second and performs three operations:

  1. Configuration check — detect if any configuration file has been modified (via file stat monitoring)
  2. Tag read cycle — iterate through all configured tags and read those whose polling interval has elapsed
  3. Command processing — check the incoming command queue for cloud-side instructions (config updates, manual reads, interval changes)

Interval-Based Polling

Each tag has a polling interval in seconds. The gateway maintains a monotonic clock timestamp of the last read for each tag. On each loop iteration:

for each tag in device.tags:
elapsed = now - tag.last_read_time
if elapsed >= tag.interval_sec:
read_tag(tag)
tag.last_read_time = now

Typical intervals by data category:

Data TypeIntervalRationale
Temperatures, pressures60sSlow-changing process values
Alarm states (booleans)1sImmediate awareness needed
Machine state (running/idle)1sOEE calculation accuracy
Batch counts1sProduction tracking
Version, serial number3600sStatic values, verify hourly

Compare Mode: Change-Based Delivery

For many tags, sending the same value every second is wasteful. If a chiller alarm bit is false for 8 hours straight, that's 28,800 redundant messages.

Compare mode solves this: the gateway stores the last-read value and only delivers to the cloud when the value changes. This is configured per tag:

{
"name": "Compressor Fault Alarm",
"type": "bool",
"interval": 1,
"compare": true,
"do_not_batch": true
}

This tag is read every second, but only transmitted when it changes. The do_not_batch flag means changes are sent immediately rather than waiting for the next batch finalization — critical for alarm states where latency matters.

Hourly Full Refresh

There's a subtle problem with pure change-based delivery: if a value changes while the MQTT connection is down, the cloud never learns about the transition. And if a value stays constant for days, the cloud has no heartbeat confirming the sensor is still alive.

The solution: every hour (on the hour change), the gateway resets all "read once" flags, forcing a complete re-read and re-delivery of all tags. This guarantees the cloud has fresh values at least hourly, regardless of change activity.

Phase 5: Data Batching and Delivery

Raw tag values don't get sent individually (except high-priority alarms). Instead, they're collected into batches for efficient delivery.

Binary Encoding

Production gateways use binary encoding rather than JSON to minimize bandwidth. The binary format packs values tightly:

Header:        1 byte  (0xF7 = tag values)
Group count: 4 bytes (number of timestamp groups)

Per group:
Timestamp: 4 bytes
Device type: 2 bytes
Serial num: 4 bytes
Value count: 4 bytes

Per value:
Tag ID: 2 bytes
Status: 1 byte (0x00=OK, else error code)
Array size: 1 byte (if status=OK)
Elem size: 1 byte (1, 2, or 4 bytes per element)
Data: size × count bytes

A batch containing 20 float values uses about 200 bytes in binary vs. ~2,000 bytes in JSON — a 10× bandwidth reduction that matters on cellular connections billed per megabyte.

Batch Finalization Triggers

A batch is finalized (sent to MQTT) when either:

  1. Size threshold — the batch reaches the configured maximum size (default: 4,000 bytes)
  2. Time threshold — the batch has been collecting for longer than batch_timeout_sec (default: 60 seconds)

This ensures data reaches the cloud within 60 seconds even during low-activity periods, while maximizing batch efficiency during high-activity periods (like a blender running a batch cycle that triggers many dependent tag reads).

The Paged Ring Buffer

Between the batching layer and the MQTT publish layer sits a paged ring buffer. This is the gateway's resilience layer against network outages.

The buffer divides available memory into fixed-size pages. Each page holds one or more complete MQTT messages. The buffer operates as a queue:

  • Write side: Finalized batches are written to the current work page. When a page fills up, it moves to the "used" queue.
  • Read side: When MQTT is connected, the gateway publishes the oldest used page. Upon receiving a PUBACK (delivery confirmation), the page moves to the "free" pool.
  • Overflow: If all pages are used (network down too long), the gateway overwrites the oldest used page — losing the oldest data to preserve the newest.

This design means the gateway can buffer 15-60 minutes of telemetry data during a network outage (depending on available memory and data density), then drain the buffer once connectivity restores.

Disconnect Recovery

When the MQTT connection drops:

  1. The buffer's "connected" flag is cleared
  2. All pending publish operations are halted
  3. Incoming PLC data continues to be read, batched, and buffered
  4. The MQTT async thread begins reconnection
  5. On reconnection, the buffer's "connected" flag is set, and data delivery resumes from the oldest undelivered page

This means zero data loss during short outages (up to the buffer capacity), and newest-data-preserved during long outages (the overflow policy drops oldest data first).

Phase 6: Remote Configuration and Control

A production gateway accepts commands from the cloud over its MQTT subscription topic. This enables remote management without SSH access.

Supported Command Types

CommandDirectionDescription
daemon_configCloud → DeviceUpdate central configuration (IP addresses, serial params)
device_configCloud → DeviceUpdate device-specific tag configuration
get_statusCloud → DeviceRequest current daemon/PLC/TCU status report
get_status_extCloud → DeviceRequest extended status with last tag values
read_now_plcCloud → DeviceForce immediate read of a specific tag
tag_updateCloud → DeviceChange a tag's polling interval remotely

Remote Interval Adjustment

This is a powerful production feature: the cloud can remotely change how often specific tags are polled. During a quality investigation, an engineer might temporarily increase temperature polling from 60s to 5s to capture rapid transients. After the investigation, they reset to 60s via another command.

The gateway applies interval changes immediately and persists them to the configuration file, so they survive a restart. The modified_intervals flag in status reports tells the cloud that intervals have been manually adjusted.

Designing for Constrained Hardware

These gateways often run on embedded Linux routers with severely constrained resources:

  • RAM: 64-128MB (of which 30-40MB is available after OS)
  • CPU: MIPS or ARM, 500-800 MHz, single core
  • Storage: 16-32MB flash (no disk)
  • Network: Cellular (LTE Cat 4/Cat M1) or Ethernet

Design constraints this imposes:

  1. Fixed memory allocation — allocate all buffers at startup, never malloc() during runtime. A memory fragmentation crash at 3 AM in a factory with no IT staff is unrecoverable.

  2. No floating-point unit — older MIPS processors do software float emulation. Keep float operations to a minimum; do heavy math in the cloud.

  3. Flash wear — don't write configuration changes to flash more than necessary. Batch writes, use write-ahead logging if needed.

  4. Watchdog timer — use the hardware watchdog timer. If the main loop hangs, the hardware reboots the gateway automatically.

How machineCDN Implements These Patterns

machineCDN's ACS (Auxiliary Communication System) gateway embodies all of these lifecycle patterns in a production-hardened implementation that's been running on thousands of plastics manufacturing machines for years.

The gateway runs on Teltonika RUT9XX industrial cellular routers, providing cellular connectivity for machines in facilities without available Ethernet. It supports EtherNet/IP and Modbus (both TCP and RTU) simultaneously, auto-detecting device types at boot and loading the appropriate configuration from a library of pre-built equipment profiles.

For manufacturers deploying machineCDN, the complexity described in this article — protocol detection, configuration management, MQTT buffering, recovery — is entirely handled by the platform. The result is that plant engineers get reliable, continuous telemetry from their equipment without needing to understand (or debug) the edge gateway's internal lifecycle.


Understanding how edge gateways actually work — not just what they do, but how they manage their lifecycle — is essential for building reliable IIoT infrastructure. The patterns described here (startup sequencing, multi-protocol detection, buffered delivery, watchdog recovery) separate toy deployments from production systems that run for years without intervention.

EtherNet/IP Device Auto-Discovery: How Edge Gateways Identify PLCs on the Plant Floor [2026]

· 9 min read

Walk onto any modern plant floor and you'll find a patchwork of controllers — Allen-Bradley Micro800 series running EtherNet/IP, Modbus TCP devices from half a dozen vendors, maybe a legacy RTU on a serial port somewhere. The edge gateway sitting in that control cabinet needs to figure out what it's talking to, what protocol to use, and how to pull the right data — ideally without a technician manually configuring every register.

This is the device auto-discovery problem, and solving it well is the difference between a two-hour commissioning versus a two-day one.

The Discovery Sequence: Try EtherNet/IP First, Fall Back to Modbus

The most reliable approach follows a dual-protocol detection pattern. When an edge gateway powers up and finds a PLC at a known IP address, it shouldn't assume which protocol that device speaks. Instead, it runs a detection sequence:

Step 1: Attempt EtherNet/IP (CIP) Connection

EtherNet/IP uses the Common Industrial Protocol (CIP) over TCP port 44818. The gateway attempts to create a connection to a known tag — typically a device_type identifier that the PLC firmware exposes as a readable tag.

Protocol: ab-eip
Gateway: 192.168.1.100
CPU: micro800
Tag: device_type
Element Size: 2 bytes (uint16)
Element Count: 1
Timeout: 2000ms

If this connection succeeds and returns a non-zero value, the gateway knows it's talking to an EtherNet/IP device and can proceed to read the serial number components.

Step 2: If EtherNet/IP fails, try Modbus TCP

If the CIP connection returns an error (typically error code -32, indicating no route to host at the CIP layer), the gateway falls back to Modbus TCP on port 502.

For Modbus detection, the gateway reads input register 800 (address 0x300320 in the full Modbus address space — function code 4). This register holds the device type identifier by convention in many industrial equipment families.

Protocol: Modbus TCP
Port: 502
Function Code: 4 (Read Input Registers)
Start Address: 800
Register Count: 1

Step 3: Extract Serial Number

Once the device type is known, the gateway reads serial number components. Here's where things get vendor-specific. Different PLC families store their serial numbers in completely different register locations:

Device TypeProtocolMonth RegisterYear RegisterUnit Register
Micro800 PLCEtherNet/IPTag: serial_number_monthTag: serial_number_yearTag: serial_number_unit
GP Chiller (1017)Modbus TCPInput Reg 22Input Reg 23Input Reg 24
HE Chiller (1018)Modbus TCPHolding Reg 520Holding Reg 510Holding Reg 500
TS5 TCU (1021)Modbus TCPHolding Reg 1039Holding Reg 1038Holding Reg 1040

Notice the inconsistency — even within the same protocol, each device family stores its serial number in different registers, uses different function codes (input registers vs. holding registers), and sometimes the year/month/unit ordering isn't sequential in memory. This is real-world industrial automation, not a textbook.

Serial Number Encoding: Packing Identity into 32 Bits

Once you have the three components (year, month, unit number), they're packed into a single 32-bit serial number for efficient transport:

Byte 3 (bits 31-24): Year  (0x00-0xFF)
Byte 2 (bits 23-16): Month (0x00-0xFF)
Bytes 1-0 (bits 15-0): Unit Number (0x0000-0xFFFF)

This encoding allows up to 65,535 units per month per year — more than sufficient for any production line. A serial number of 0x18031A2B decodes to: year 0x18 (24), month 0x03 (March), unit 0x1A2B (6699).

Validation Matters

A serial number where the year byte is zero is invalid — it almost certainly means the PLC hasn't been properly commissioned or the register read returned garbage data. Your gateway should reject these and report a "bad serial number" status rather than silently accepting a device with identity 0x00000000.

The Configuration Lookup Pattern

Once the gateway knows the device type (e.g., type 1018 = HE Central Chiller), it needs to load the right tag configuration. The proven pattern is a directory scan:

  1. Maintain a directory of JSON configuration files (one per device type)
  2. On detection, scan the directory and match the device_type field in each JSON
  3. Load the matched configuration, which defines all tags, their data types, read intervals, and batching behavior
{
"device_type": 1018,
"version": "2.4.1",
"name": "HE Central Chiller",
"protocol": "modbus-tcp",
"plctags": [
{
"name": "supply_temp",
"id": 1,
"type": "float",
"addr": 400100,
"ecount": 2,
"interval": 5,
"compare": true
},
{
"name": "compressor_status",
"id": 2,
"type": "uint16",
"addr": 400200,
"interval": 1,
"compare": true,
"do_not_batch": true
}
]
}

Key design decisions in this configuration:

  • compare: true means only transmit when the value changes — critical for reducing bandwidth on cellular connections
  • do_not_batch: true means send immediately rather than accumulating in a batch — used for status changes and alarms that need real-time delivery
  • interval defines the polling frequency in seconds — fast-changing temperatures might be 5 seconds, while a compressor on/off status needs sub-second reads
  • ecount: 2 for floats means reading two consecutive 16-bit Modbus registers and combining them into an IEEE 754 float

Handling Modbus Address Conventions

One of the trickiest aspects of Modbus auto-discovery is the address-to-function-code mapping. Different vendors use different conventions, but the most common maps addresses to function codes like this:

Address RangeFunction CodeRegister Type
0–65536FC 1Coils (read/write bits)
100000–165536FC 2Discrete Inputs (read-only bits)
300000–365536FC 4Input Registers (read-only 16-bit)
400000–465536FC 3Holding Registers (read/write 16-bit)

When you see a configured address of 400100, the gateway strips the prefix: the actual Modbus register address sent on the wire is 100, using function code 3.

Register Grouping Optimization

Smart gateways don't read one register at a time. They scan the sorted tag list and identify contiguous address ranges that share the same function code and polling interval. These get combined into a single Modbus read request:

Tags at addresses: 400100, 400101, 400102, 400103, 400104
→ Single request: FC3, start=100, count=5

But grouping has limits. Exceeding ~50 registers per request risks timeouts, especially on Modbus RTU over slow serial links. And you can't group across function code boundaries — a tag at address 300050 (FC4) and 400050 (FC3) must be separate requests, even though they're "near" each other numerically.

Multi-Protocol Detection: The Real-World Sequence

In practice, a gateway on a plant floor often needs to detect multiple devices simultaneously — a PLC on EtherNet/IP and a temperature control unit on Modbus RTU via RS-485. The detection sequence runs in parallel:

  1. EtherNet/IP detection happens over the plant's Ethernet network — standard TCP/IP, fast, usually succeeds or fails within 2 seconds
  2. Modbus TCP detection uses the same Ethernet interface but different port (502) — also fast
  3. Modbus RTU detection happens over a serial port (/dev/ttyUSB0 or similar) — much slower, constrained by baud rate (typically 9600–115200), with byte timeouts around 50ms and response timeouts of 400ms

The serial link parameters are critical and often misconfigured:

Port: /dev/ttyUSB0
Baud Rate: 9600
Parity: None ('N')
Data Bits: 8
Stop Bits: 1
Slave Address: 1
Byte Timeout: 50ms
Response Timeout: 400ms

Getting the parity wrong is the #1 commissioning mistake with Modbus RTU. If the slave expects Even parity and the master sends None, every frame will be rejected silently — no error message, just timeouts.

Connection Resilience: The Watchdog Pattern

Discovery isn't a one-time event. Industrial connections drop — cables get unplugged during maintenance, PLCs get rebooted, network switches lose power. A robust gateway implements a multi-layer resilience strategy:

Link State Tracking: Every successful read sets the link state to "up." Any read error (timeout, connection reset, broken pipe, bad file descriptor) sets it to "down" and triggers a reconnection sequence.

Connection Error Counting: For EtherNet/IP, if you get three consecutive error-32 responses (no CIP route), stop hammering the network and wait for the next polling cycle. For Modbus, error codes like ETIMEDOUT, ECONNRESET, ECONNREFUSED, or EPIPE trigger a modbus_close() followed by reconnection on the next cycle.

Modbus Flush on Error: After a failed Modbus read, always flush the serial/TCP buffer before the next attempt. Stale response bytes from a partial read can corrupt subsequent responses.

Configuration Hot-Reload: The gateway watches its configuration files with stat(). If a file's modification time changes, it triggers a full re-initialization — destroy existing PLC tag handles, reload the JSON configuration, and re-establish all connections. This allows field engineers to update tag configurations without restarting the gateway service.

What machineCDN Brings to the Table

machineCDN's edge infrastructure handles this entire discovery and connection management lifecycle automatically. When you deploy a machineCDN gateway on the plant floor:

  • It auto-detects PLCs across EtherNet/IP and Modbus TCP/RTU simultaneously
  • It loads the correct device configuration from its library of supported equipment types
  • It manages connection resilience with automatic reconnection and buffer management
  • It optimizes Modbus reads by grouping contiguous registers and minimizing request count
  • Tag data flows through a batched delivery pipeline to the cloud, with store-and-forward buffering during connectivity gaps

For plant engineers, this means going from "cable plugged in" to "live data flowing" in minutes rather than days of manual register mapping.

Key Takeaways

  1. Always try EtherNet/IP first — it's faster and provides richer device identity information than Modbus
  2. Don't hardcode serial number locations — they vary wildly across equipment families, even from the same vendor
  3. Validate serial numbers before accepting a device — zero year values indicate bad reads
  4. Group Modbus reads by contiguous address and function code, but cap at 50 registers per request
  5. Implement connection watchdogs — industrial networks are unreliable; your gateway must recover automatically
  6. Flush after errors — stale buffer bytes from partial Modbus reads are the silent killer of data integrity

The device discovery problem isn't glamorous, but getting it right is what separates an IIoT platform that works in the lab from one that survives on a real plant floor.

JSON-Based PLC Tag Configuration: Building Maintainable IIoT Device Templates [2026]

· 12 min read

If you've ever stared at a spreadsheet of 200 PLC register addresses trying to figure out which ones your SCADA system is actually polling, you know the pain. Traditional tag configuration — hardcoded in ladder logic comments, scattered across HMI screens, buried in proprietary configuration tools — doesn't scale.

The solution that's gaining traction in modern IIoT deployments is declarative, JSON-based tag configuration. Instead of configuring your data collection logic in opaque proprietary formats, you define your device's entire tag map as a structured JSON document. This approach brings version control, template reuse, and automated validation to the industrial data layer.

In this guide, we'll walk through the architecture of a production-grade JSON tag configuration system, drawing from real patterns used in industrial edge gateways connecting to Allen-Bradley Micro800 PLCs via EtherNet/IP and to various devices via Modbus RTU and TCP.

JSON-based PLC tag configuration for IIoT

Why JSON for PLC Tag Configuration?

The traditional approach to configuring PLC data collection involves vendor-specific tools: RSLinx for Allen-Bradley, TIA Portal for Siemens, or proprietary gateway configurators. These tools work, but they create several problems at scale:

  • No version control. You can't git diff a proprietary binary config file.
  • No templating. When you deploy the same machine type across 50 sites, you're manually recreating the same configuration 50 times.
  • No validation. Typos in register addresses don't surface until runtime.
  • No automation. You can't script the generation of configurations from a master device database.

JSON solves all of these. A tag configuration becomes a text file that can be:

  • Stored in Git with full change history
  • Templated per device type (one JSON per machine model)
  • Validated against a schema before deployment
  • Generated programmatically from engineering databases

Anatomy of a Tag Configuration Document

A well-structured PLC tag configuration document needs to capture several layers of information:

Device-Level Metadata

Every configuration file should identify the device type it applies to, carry a version string for change tracking, and specify the protocol:

{
"device_type": 1010,
"version": "a3f7b2c",
"name": "Continuous Blender Model X",
"protocol": "ethernet-ip",
"plctags": [ ... ]
}

The device_type field is a numeric identifier that maps to a specific machine model. When an edge gateway auto-detects a PLC (by reading a known register), it uses this type ID to look up the correct configuration file. The version field — ideally a short Git hash — lets you track which configuration version is running on each gateway in the field.

For Modbus devices, you'd also include protocol-specific parameters:

{
"device_type": 5000,
"version": "b8e1d4a",
"name": "Temperature Control Unit",
"protocol": "modbus-rtu",
"base_addr": 48,
"baud": 9600,
"parity": "even",
"data_bits": 8,
"stop_bits": 1,
"byte_timeout": 4,
"resp_timeout": 100,
"plctags": [ ... ]
}

Notice the serial link parameters are part of the same document. This is deliberate — you want a single source of truth for "how to talk to this device and what to read from it."

Tag Definitions: The Core Data Model

Each tag in the configuration represents a single data point you want to collect from the PLC. A complete tag definition captures:

{
"name": "barrel_zone1_temp",
"id": 42,
"type": "float",
"ecount": 2,
"sindex": 0,
"interval": 5,
"compare": true,
"do_not_batch": false
}

Let's break down each field:

name — A human-readable identifier for the tag. For EtherNet/IP (CIP) devices, this is the actual PLC tag name. For Modbus, it's a descriptive label since Modbus uses numeric addresses.

id — A numeric identifier used in the wire protocol when transmitting data to the cloud. Using compact integer IDs instead of string names dramatically reduces payload sizes — critical when you're sending telemetry over cellular connections.

type — The data type of the register value. Common types include:

TypeSizeRangeUse Case
bool1 byte0 or 1Alarm states, run/stop status
int81 byte-128 to 127Small counters, mode selectors
uint81 byte0 to 255Status codes, alarm bytes
int162 bytes-32,768 to 32,767Temperature (×10), pressure
uint162 bytes0 to 65,535RPM, flow rate, raw ADC values
int324 bytes±2.1 billionProduction counters, energy
uint324 bytes0 to 4.2 billionLifetime counters, timestamps
float4 bytesIEEE 754Temperature, weight, setpoints

ecount (element count) — How many consecutive elements to read. For a single register, this is 1. For a 32-bit float stored across two Modbus registers, this is 2. For an array of 10 temperature readings, this is 10.

sindex (start index) — The starting element index for array reads. Combined with ecount, this lets you read slices of PLC arrays without pulling the entire array.

interval — How often (in seconds) to poll this tag. This is where you make intelligent decisions about bandwidth:

  • 1 second: Critical alarms, emergency stops, safety interlocks
  • 5 seconds: Process temperatures, pressures, flows
  • 30 seconds: Setpoints, mode selectors (change infrequently)
  • 300 seconds: Configuration parameters, serial numbers

compare — When true, the gateway compares each new reading against the previous value and only transmits if the value changed. This is the single most impactful optimization for reducing bandwidth and cloud ingestion costs.

do_not_batch — When true, the value is transmitted immediately rather than being accumulated into a batch payload. Use this for critical alarms that need sub-second cloud visibility.

Modbus Address Conventions

For Modbus devices, each tag also carries an addr field that encodes both the register address and the function code:

{
"name": "process_temp",
"id": 10,
"addr": 400100,
"type": "float",
"ecount": 2,
"interval": 5,
"compare": true
}

The address convention follows a well-established pattern:

Address RangeModbus Function CodeRegister Type
0 – 65,536FC 01Coils (read/write)
100,000 – 165,536FC 02Discrete Inputs (read)
300,000 – 365,536FC 04Input Registers (read)
400,000 – 465,536FC 03Holding Registers (R/W)

So addr: 400100 means "holding register at address 100, read via function code 3." This convention eliminates ambiguity about which Modbus function to use — the address itself encodes it.

Why this matters: A common source of bugs in Modbus deployments is using the wrong function code. Someone configures a tag to read address 100 with FC 03 when the device exposes it as an input register (FC 04). With the address convention above, the function code is implicit and unambiguous.

Advanced Patterns: Calculated and Dependent Tags

Simple register reads cover 80% of use cases. But industrial devices often pack multiple boolean values into a single 16-bit alarm word, or have tags whose values only matter when a parent tag changes.

Calculated Tags: Extracting Bits from Alarm Words

Many PLCs pack 16 individual alarm flags into a single uint16 register. Rather than reading 16 separate coils, you read one register and extract the bits:

{
"name": "alarm_word_1",
"id": 50,
"addr": 400200,
"type": "uint16",
"ecount": 1,
"interval": 1,
"compare": true,
"calculated": [
{
"name": "high_temp_alarm",
"id": 51,
"type": "bool",
"shift": 0,
"mask": 1
},
{
"name": "low_pressure_alarm",
"id": 52,
"type": "bool",
"shift": 1,
"mask": 1
},
{
"name": "motor_overload",
"id": 53,
"type": "bool",
"shift": 2,
"mask": 1
}
]
}

When alarm_word_1 is read, the gateway automatically:

  1. Reads the raw uint16 value
  2. For each calculated tag, applies the right-shift and mask to extract the bit
  3. Compares the extracted boolean against its previous value
  4. Only transmits if the bit actually changed

This is vastly more efficient than polling 16 individual coils — one Modbus read instead of 16, with identical semantic output.

Dependent Tags: Event-Driven Secondary Reads

Some tags only need to be read when a related tag changes. For example, you might have a machine_state register that changes between IDLE, RUNNING, and FAULT. When it changes, you want to immediately read a block of diagnostic registers — but you don't want to poll those diagnostics every cycle when the machine state is stable.

{
"name": "machine_state",
"id": 100,
"addr": 400001,
"type": "uint16",
"ecount": 1,
"interval": 1,
"compare": true,
"dependents": [
{
"name": "fault_code",
"id": 101,
"addr": 400010,
"type": "uint16",
"ecount": 1,
"interval": 60
},
{
"name": "fault_timestamp",
"id": 102,
"addr": 400011,
"type": "uint32",
"ecount": 2,
"interval": 60
}
]
}

When machine_state changes, the gateway forces an immediate read of all dependent tags, regardless of their normal polling interval. This gives you:

  • Low latency on state transitions — fault diagnostics arrive within 1 second of the fault occurring
  • Low bandwidth during steady state — diagnostic registers are only polled every 60 seconds when nothing is happening

Contiguous Register Optimization

One of the most impactful optimizations in Modbus data collection is contiguous register grouping. Instead of making separate Modbus read requests for each tag, the gateway sorts tags by address and groups adjacent registers into single bulk reads.

Consider these tags:

[
{ "name": "temp_1", "addr": 400100, "ecount": 1 },
{ "name": "temp_2", "addr": 400101, "ecount": 1 },
{ "name": "temp_3", "addr": 400102, "ecount": 1 },
{ "name": "pressure", "addr": 400103, "ecount": 2 }
]

A naive implementation makes four separate Modbus requests. An optimized one makes one request: read 5 registers starting at address 400100. The response contains all four values, which are dispatched to the correct tag definitions.

For this optimization to work, the configuration system must:

  1. Sort tags by address at load time, not at runtime
  2. Validate that function codes match — you can't group a coil read (FC 01) with a holding register read (FC 03)
  3. Respect maximum packet sizes — Modbus TCP allows up to 125 registers per read; some devices are more restrictive
  4. Respect polling intervals — only group tags that share the same polling interval

The performance difference is dramatic. A typical PLC with 50 Modbus tags might require 50 individual reads (50 × ~10ms = 500ms per cycle) or 5 grouped reads (5 × ~10ms = 50ms per cycle). That's a 10× improvement in polling speed.

IEEE 754 Float Handling: The Register Order Problem

Reading 32-bit floating-point values over Modbus is notoriously tricky because the Modbus specification doesn't define register byte ordering for multi-register values. A float spans two 16-bit registers, and different PLCs may store them in different orders:

  • Big-endian (AB CD): Register N contains the high word, N+1 the low word
  • Little-endian (CD AB): Register N contains the low word, N+1 the high word
  • Mid-endian (BA DC or DC BA): Each word's bytes are swapped

Your tag configuration should support specifying the byte order, or at least document which convention your gateway assumes. Most libraries (libmodbus, for example) provide helper functions like modbus_get_float() that assume big-endian by default — but always verify against your specific PLC.

Pro tip: When commissioning a new device, read a register where you know the expected value (e.g., a temperature setpoint showing 72.0°F on the HMI). If the gateway reads 72.0, your byte order is correct. If it reads 2.388e-38 or 1.23e+12, you have a byte-order mismatch.

Binary vs. JSON Telemetry Encoding

Once you've collected your tag values, you need to transmit them. Your configuration should support both JSON and binary encoding, with the choice driven by bandwidth constraints:

JSON encoding is human-readable and debuggable:

{
"groups": [{
"ts": 1709500800,
"device_type": 1010,
"serial_number": 85432,
"values": [
{ "id": 42, "values": [72.3] },
{ "id": 43, "values": [true] }
]
}]
}

Binary encoding is 3-5× smaller. A typical binary frame packs:

  • 1-byte header marker
  • 4-byte group count
  • Per group: 4-byte timestamp, 2-byte device type, 4-byte serial number, 4-byte value count
  • Per value: 2-byte tag ID, 1-byte status, 1-byte value count, 1-byte value size, then raw value bytes

A batch that's 2,000 bytes in JSON might be 400 bytes in binary. Over a cellular connection billed per megabyte, that savings compounds fast.

Putting It All Together: Configuration Lifecycle

A production deployment follows this lifecycle:

  1. Template creation: For each machine model, create a JSON tag configuration. Store it in Git.
  2. Deployment: Push configurations to edge gateways via your device management platform. The gateway monitors the config file and reloads automatically when it changes.
  3. Auto-detection: When the gateway starts, it queries the PLC for its device type (a known register). It then matches the type to the correct configuration file.
  4. Validation: At load time, validate register addresses (no duplicates, valid ranges), data types, and interval values. Reject invalid configs before they cause runtime errors.
  5. Runtime: The gateway polls tags according to their configured intervals, applies change detection, groups contiguous registers, and batches values for transmission.

How machineCDN Handles Tag Configuration

machineCDN's edge gateway uses this exact pattern — JSON-based device templates that are automatically selected based on PLC auto-detection. Each machine type in a plastics manufacturing facility (blenders, dryers, granulators, chillers, TCUs) has its own configuration template with pre-mapped tags, optimized polling intervals, and calculated alarm decomposition.

When a new machine is connected, the gateway detects the PLC type, loads the matching template, and starts collecting data — typically in under 30 seconds with zero manual configuration. For plants running 20+ machines across 5 different models, this eliminates weeks of commissioning time.

Common Pitfalls

1. Overlapping addresses. Two tags pointing to the same register with different IDs will cause confusion in your data pipeline. Validate for uniqueness at load time.

2. Wrong element count for floats. A 32-bit float on Modbus requires ecount: 2 (two 16-bit registers). Setting ecount: 1 gives you garbage data.

3. Polling too fast on serial links. Modbus RTU over RS-485 at 9600 baud can handle roughly 10-15 register reads per second. If you configure 50 tags at 1-second intervals, you'll never keep up. Budget your polling rate against your link speed.

4. Missing change detection on high-volume tags. Without compare: true, every reading gets transmitted. For a tag polled every second, that's 86,400 data points per day — even if the value never changed.

5. Batch timeout too long. If your batch timeout is 60 seconds but an alarm fires, it won't reach the cloud for up to a minute unless that alarm tag has do_not_batch: true.

Conclusion

JSON-based tag configuration isn't just a nice-to-have — it's a fundamental enabler for scaling IIoT deployments. It brings software engineering best practices (version control, templating, validation, automation) to a domain that has traditionally relied on manual, vendor-specific tooling.

The key design principles are:

  • One file per device type with version tracking
  • Rich tag metadata covering data types, intervals, and delivery modes
  • Hierarchical relationships for calculated and dependent tags
  • Protocol-aware addressing that encodes function codes implicitly
  • Contiguous register grouping for optimal Modbus performance

Get this foundation right, and you'll spend your time analyzing machine data instead of debugging data collection.

Dependent Tag Architectures: Building Event-Driven Data Hierarchies in Industrial IoT [2026]

· 10 min read

Most IIoT platforms treat every data point as equal. They poll each tag on a fixed schedule, blast everything to the cloud, and let someone else figure out what matters. That approach works fine when you have ten tags. It collapses when you have ten thousand.

Production-grade edge systems take a fundamentally different approach: they model relationships between tags — parent-child dependencies, calculated values derived from raw registers, and event-driven reads that fire only when upstream conditions change. The result is dramatically less bus traffic, lower latency on the signals that matter, and a data architecture that mirrors how the physical process actually works.

This article is a deep technical guide to building these hierarchical tag architectures from the ground up.

Dependent tag architecture for IIoT

The Problem with Flat Polling

In a traditional SCADA or IIoT setup, the edge gateway maintains a flat list of tags. Each tag has an address and a polling interval:

Tag: Barrel_Temperature    Address: 40001    Interval: 1s
Tag: Screw_Speed Address: 40002 Interval: 1s
Tag: Mold_Pressure Address: 40003 Interval: 1s
Tag: Machine_State Address: 40010 Interval: 1s
Tag: Alarm_Word_1 Address: 40020 Interval: 1s
Tag: Alarm_Word_2 Address: 40021 Interval: 1s

Every second, the gateway reads every tag — regardless of whether anything changed. This creates three problems:

  1. Bus saturation on serial links. A Modbus RTU link at 9600 baud can handle roughly 10–15 register reads per second. With 200 tags at 1-second intervals, you're mathematically guaranteed to fall behind.

  2. Wasted bandwidth to the cloud. If barrel temperature hasn't changed in 30 seconds, you're uploading the same value 30 times. At $0.005 per MQTT message on most cloud IoT services, that adds up.

  3. Missing the events that matter. When everything polls at the same rate, a critical alarm state change gets the same priority as a temperature reading that hasn't moved in an hour.

Introducing Tag Hierarchies

A dependent tag architecture introduces three concepts:

1. Parent-Child Dependencies

A dependent tag is one that only gets read when its parent tag's value changes. Consider a machine status word. When the status word changes from "Running" to "Fault," you want to immediately read all the associated diagnostic registers. When the status word hasn't changed, those diagnostic registers are irrelevant.

# Conceptual configuration
parent_tag:
name: machine_status_word
address: 40010
interval: 1s
compare: true
dependent_tags:
- name: fault_code
address: 40011
- name: fault_timestamp
address: 40012-40013
- name: last_setpoint
address: 40014

When machine_status_word changes, the edge daemon immediately performs a forced read of all three dependent tags and delivers them in the same telemetry group — with the same timestamp. This guarantees temporal coherence: the fault code, timestamp, and last setpoint all share the exact timestamp of the state change that triggered them.

2. Calculated Tags

A calculated tag is a virtual data point derived from a parent tag's raw value through bitwise operations. The most common use case: decoding packed alarm words.

Industrial PLCs frequently pack 16 boolean alarms into a single 16-bit register. Rather than polling 16 separate coil addresses (which requires 16 Modbus transactions), you read one holding register and extract each bit:

Alarm_Word_1 (uint16 at 40020):
Bit 0 → High Temperature Alarm
Bit 1 → Low Pressure Alarm
Bit 2 → Motor Overload
Bit 3 → Emergency Stop Active
...
Bit 15 → Communication Fault

A well-designed edge gateway handles this decomposition at the edge:

parent_tag:
name: alarm_word_1
address: 40020
type: uint16
interval: 1s
compare: true # Only process when value changes
do_not_batch: true # Deliver immediately — don't wait for batch timeout
calculated_tags:
- name: high_temp_alarm
type: bool
shift: 0
mask: 0x01
- name: low_pressure_alarm
type: bool
shift: 1
mask: 0x01
- name: motor_overload
type: bool
shift: 2
mask: 0x01
- name: estop_active
type: bool
shift: 3
mask: 0x01

The beauty of this approach:

  • One Modbus read instead of sixteen
  • Zero cloud processing — the edge already decomposed the alarm word into named boolean tags
  • Change-driven delivery — if the alarm word hasn't changed, nothing gets sent. When bit 2 flips from 0 to 1, only the changed calculated tags get delivered.

3. Comparison-Based Delivery

The compare flag on a tag definition tells the edge daemon to track the last-known value and suppress delivery when the new value matches. This is distinct from a polling interval — the tag still gets read on schedule, but the value only gets delivered when it changes.

This is particularly powerful for:

  • Status words and mode registers that change infrequently
  • Alarm bits where you care about transitions, not steady state
  • Setpoint registers that only change when an operator makes an adjustment

A well-implemented comparison handles type-aware equality. Comparing two float values with bitwise equality is fine for PLC registers (they're IEEE 754 representations read directly from memory — no floating-point arithmetic involved). Comparing two uint16 values is straightforward. The edge daemon should store the raw bytes, not a converted representation.

Register Grouping: The Foundation

Before dependent tags can work efficiently, the underlying polling engine needs contiguous register grouping. This is the practice of combining multiple tags into a single Modbus read request when their addresses are adjacent.

Consider these five tags:

Tag A: addr 40001, type uint16  (1 register)
Tag B: addr 40002, type uint16 (1 register)
Tag C: addr 40003, type float (2 registers)
Tag D: addr 40005, type uint16 (1 register)
Tag E: addr 40010, type uint16 (1 register) ← gap

An intelligent polling engine groups A through D into a single Read Holding Registers call: start address 40001, quantity 5. Tag E starts a new group because there's a 5-register gap.

The grouping rules are:

  1. Same function code. You can't combine holding registers (FC03) with input registers (FC04) in one read.
  2. Contiguous addresses. Any gap breaks the group.
  3. Same polling interval. A tag polling at 1s and a tag polling at 60s shouldn't be in the same group.
  4. Maximum group size. The Modbus spec limits a single read to 125 registers (some devices impose lower limits — 50 is a safe practical maximum).

After the bulk read returns, the edge daemon dispatches individual register values to each tag definition, handling type conversion per tag (uint16, int16, float from two consecutive registers, etc.).

The 32-Bit Float Problem

When a tag spans two Modbus registers (common for 32-bit integers and IEEE 754 floats), the edge daemon must handle word ordering. Some PLCs store the high word first (big-endian), others store the low word first (little-endian). A typical edge system stores the raw register pair and then calls the appropriate conversion:

  • Big-endian (AB CD): value = (register[0] << 16) | register[1]
  • Little-endian (CD AB): value = (register[1] << 16) | register[0]

For IEEE 754 floats, the 32-bit integer is reinterpreted as a floating-point value. Getting this wrong produces garbage data — a common source of "the numbers look random" support tickets.

Architecture: Tying It Together

Here's how a production edge system processes a single polling cycle with dependent tags:

1. Start timestamp group (T = now)
2. For each tag in the poll list:
a. Check if interval has elapsed since last read
b. If not due, skip (but check if it's part of a contiguous group)
c. Read tag (or group of tags) from PLC
d. If compare=true and value unchanged: skip delivery
e. If compare=true and value changed:
i. Deliver value (batched or immediate)
ii. If tag has calculated_tags: compute each one, deliver
iii. If tag has dependent_tags:
- Finalize current batch group
- Force-read all dependent tags (recursive)
- Start new batch group
f. Update last-known value and last-read timestamp
3. Finalize timestamp group

The critical detail is step (e)(iii): when a parent tag triggers a dependent read, the current batch group gets finalized and the dependent tags are read in a forced mode (ignoring their individual interval timers). This ensures the dependent values reflect the state at the moment of the parent's change, not some future polling cycle.

Practical Considerations

On Modbus RTU, the 3.5-character silent interval between frames is mandatory. At 9600 baud with 8N1 encoding, one character takes ~1.04ms, so the minimum inter-frame gap is ~3.64ms. With a typical request frame of 8 bytes and a response frame of 5 + 2*N bytes (for N registers), a single read of 10 registers takes approximately:

Request:    8 bytes × 1.04ms = 8.3ms
Turnaround: ~3.5ms (device processing)
Response: (5 + 20) bytes × 1.04ms = 26ms
Gap: 3.64ms
Total: ~41.4ms per read

This means you can fit roughly 24 read operations per second on a 9600-baud link. If you're polling 150 tags with 1-second intervals, grouping is not optional — it's survival.

Alarm Tag Design

For alarm words, always configure:

  • compare: true — only deliver when an alarm state changes
  • do_not_batch: true — bypass the batch timeout and deliver immediately
  • interval: 1 (1 second) — poll frequently to catch transient alarms

Process variables like temperatures and pressures can safely use longer intervals (30–60 seconds) with compare: false since trending data benefits from regular samples.

Avoiding Circular Dependencies

If Tag A is dependent on Tag B, and Tag B is dependent on Tag A, you'll create an infinite recursion in the read loop. Production systems guard against this by either:

  • Limiting dependency depth (typically 1–2 levels)
  • Tracking a "reading" flag to prevent re-entry
  • Flattening the graph at configuration parse time

Hourly Full-Refresh

Even with change-driven delivery, it's good practice to force-read and deliver all tags at least once per hour. This catches any edge cases where a value changed but the change was missed (e.g., a brief network hiccup that caused a read failure during the exact moment of change). A simple approach: track the hour boundary and reset the "already read" flag on all tags when the hour rolls over.

How machineCDN Handles Tag Hierarchies

machineCDN's edge infrastructure supports all three relationship types natively. When you configure a device in the platform, you define parent-child dependencies, calculated alarm bits, and comparison-based delivery in the device configuration — no custom scripting required.

The platform's edge daemon handles contiguous register grouping automatically, supports both EtherNet/IP and Modbus (TCP and RTU) from the same configuration model, and provides dual-format batch delivery (JSON for debugging, binary for bandwidth efficiency). Alarm tags are delivered immediately outside the batch cycle, ensuring sub-second alert latency even when the batch timeout is set to 30 seconds.

For teams managing fleets of machines across multiple plants, this means the tag architecture you define once gets deployed consistently to every edge gateway — whether it's monitoring a chiller system with 160+ process variables or a simple TCU with 20 tags.

Key Takeaways

  1. Model relationships, not just addresses. Tags have dependencies that mirror the physical process. Your data architecture should reflect that.
  2. Use comparison to suppress noise. A status word that hasn't changed in 6 hours doesn't need 21,600 duplicate deliveries.
  3. Calculated tags eliminate cloud processing. Decompose packed alarm words at the edge — one Modbus read becomes 16 named boolean signals.
  4. Dependent reads guarantee temporal coherence. When a parent changes, all children are read with the same timestamp.
  5. Group contiguous registers ruthlessly. On serial links, the difference between grouped and ungrouped reads is the difference between working and not working.

The flat-list polling model was fine for SCADA systems monitoring 50 tags on a single HMI. For IIoT platforms handling thousands of data points across fleets of machines, hierarchical tag architectures aren't an optimization — they're the foundation.

EtherNet/IP and CIP: A Practical Guide for Plant Engineers [2026]

· 11 min read

If you've ever connected to an Allen-Bradley Micro800 or CompactLogix PLC, you've used EtherNet/IP — whether you knew it or not. It's one of the most widely deployed industrial Ethernet protocols in North America, and for good reason: it runs on standard Ethernet hardware, supports TCP/IP natively, and handles everything from high-speed I/O updates to configuration and diagnostics over a single cable.

But EtherNet/IP is more than just "Modbus over Ethernet." Its underlying protocol — the Common Industrial Protocol (CIP) — is a sophisticated object-oriented messaging framework that fundamentally changes how edge devices, gateways, and cloud platforms interact with PLCs.

This guide covers what plant engineers and IIoT architects actually need to know.

PLC Connection Resilience: Link-State Monitoring and Automatic Recovery for IIoT Gateways [2026]

· 9 min read

In any industrial IIoT deployment, the connection between your edge gateway and the PLC is the most critical — and most fragile — link in the data pipeline. Ethernet cables get unplugged during maintenance. Serial lines pick up noise from VFDs. PLCs go into fault mode and stop responding. Network switches reboot.

If your edge software can't detect these failures, recover gracefully, and continue collecting data once the link comes back, you don't have a monitoring system — you have a monitoring hope.

This guide covers the real-world engineering patterns for building resilient PLC connections, drawn from years of deploying gateways on factory floors where "the network just works" is a fantasy.

PLC connection resilience and link-state monitoring

Why Connection Resilience Isn't Optional

Consider what happens when a Modbus TCP connection silently drops:

  • No timeout configured? Your gateway hangs on a blocking read forever.
  • No reconnection logic? You lose all telemetry until someone manually restarts the service.
  • No link-state tracking? Your cloud dashboard shows stale data as if the machine is still running — potentially masking a safety-critical failure.

In a 2024 survey of manufacturing downtime causes, 17% of IIoT data gaps were attributed to gateway-to-PLC communication failures that weren't detected for hours. The machines were fine. The monitoring was blind.

The foundation of connection resilience is treating the PLC connection as a state machine with explicit transitions:

┌──────────┐     connect()      ┌───────────┐
│ │ ─────────────────► │ │
│ DISCONNECTED │ │ CONNECTED │
│ (state=0) │ ◄───────────────── │ (state=1) │
│ │ error detected │ │
└──────────┘ └───────────┘

Every time the link state changes, the gateway should:

  1. Log the transition with a precise timestamp
  2. Deliver a special link-state tag upstream so the cloud platform knows the device is offline
  3. Suppress stale data delivery — never send old values as if they're fresh
  4. Trigger reconnection logic appropriate to the protocol

One of the most powerful patterns is treating link state as a virtual tag with its own ID — distinct from any physical PLC tag. When the connection drops, the gateway immediately publishes:

{
"tag_id": "0x8001",
"type": "bool",
"value": false,
"timestamp": 1709395200
}

When it recovers:

{
"tag_id": "0x8001",
"type": "bool",
"value": true,
"timestamp": 1709395260
}

This gives the cloud platform (and downstream analytics) an unambiguous signal. Dashboards can show a "Link Down" banner. Alert rules can fire. Downtime calculations can account for monitoring gaps vs. actual machine downtime.

The link-state tag should be delivered outside the normal batch — immediately, with QoS 1 — so it arrives even if the regular telemetry buffer is full.

Protocol-Specific Failure Detection

Modbus TCP

Modbus TCP connections fail in predictable ways. The key errors that indicate a lost connection:

ErrorMeaningAction
ETIMEDOUTResponse never arrivedClose + reconnect
ECONNRESETPLC reset the TCP connectionClose + reconnect
ECONNREFUSEDPLC not listening on port 502Close + retry after delay
EPIPEBroken pipe (write to closed socket)Close + reconnect
EBADFFile descriptor invalidDestroy context + rebuild

When any of these occur, the correct sequence is:

  1. Call flush() to clear any pending data in the socket buffer
  2. Close the Modbus context
  3. Set the link state to disconnected
  4. Deliver the link-state tag
  5. Wait before reconnecting (back-off strategy)
  6. Re-create the TCP context and reconnect

Critical detail: After a connection failure, you should flush the serial/TCP buffer before attempting reads. Stale bytes in the buffer will cause desynchronization — the gateway reads the response to a previous request and interprets it as the current one, producing garbage data.

# Pseudocode — Modbus TCP recovery sequence
on_read_error(errno):
modbus_flush(context)
modbus_close(context)
link_state = DISCONNECTED
deliver_link_state(0)

# Don't reconnect immediately — the PLC might be rebooting
sleep(5 seconds)

result = modbus_connect(context, ip, port)
if result == OK:
link_state = CONNECTED
deliver_link_state(1)
force_read_all_tags() # Re-read everything to establish baseline

Modbus RTU (Serial)

Serial connections have additional failure modes that TCP doesn't:

  • Baud rate mismatch after PLC firmware update
  • Parity errors from electrical noise (especially near VFDs or welding equipment)
  • Silence on the line — device powered off or address conflict

For Modbus RTU, timeout tuning is critical:

  • Byte timeout: How long to wait between characters within a frame (typically 50ms)
  • Response timeout: How long to wait for the complete response after sending a request (typically 400ms for serial, can go lower for TCP)

If the response timeout is too short, you'll get false disconnections on slow PLCs. Too long, and a genuine failure takes forever to detect. For most industrial environments:

Byte timeout: 50ms (adjust for baud rates below 9600)
Response timeout: 400ms for RTU, 2000ms for TCP

After any RTU failure, flush the serial buffer. Serial buffers accumulate noise bytes during disconnections, and these will corrupt the first valid response after reconnection.

EtherNet/IP (CIP)

EtherNet/IP connections through the CIP protocol have a different failure signature. The libplctag library (commonly used for Allen-Bradley Micro800 and CompactLogix PLCs) returns specific error codes:

  • Error -32: Gateway cannot reach the PLC. This is the most common failure — it means the TCP connection to the gateway succeeded, but the CIP path to the PLC is broken.
  • Negative tag handle on create: The tag path is wrong, or the PLC program was downloaded with different tag names.

For EtherNet/IP, a smart approach is to count consecutive -32 errors and break the reading cycle after a threshold (typically 3 attempts):

# Stop hammering a dead connection
if consecutive_error_32_count >= MAX_ATTEMPTS:
set_link_state(DISCONNECTED)
break_reading_cycle()
wait_and_retry()

This prevents the gateway from spending its entire polling cycle sending requests to a PLC that clearly isn't responding, which would delay reads from other devices on the same gateway.

Contiguous Read Failure Handling

When reading multiple Modbus registers in a contiguous block, a single failure takes out the entire block. The gateway should:

  1. Attempt up to 3 retries for the same register block before declaring failure
  2. Report failure status per-tag — each tag in the block gets an error status, not just the block head
  3. Only deliver error status on state change — if a tag was already in error, don't spam the cloud with repeated error messages
# Retry logic for contiguous Modbus reads
read_count = 3
do:
result = modbus_read_registers(start_addr, count, buffer)
read_count -= 1
while (result != count) AND (read_count > 0)

if result != count:
# All retries failed — mark entire block as error
for each tag in block:
if tag.last_status != ERROR:
deliver_error(tag)
tag.last_status = ERROR

The Hourly Reset Pattern

Here's a pattern that might seem counterintuitive: force-read all tags every hour, regardless of whether values changed.

Why? Because in long-running deployments, subtle drift accumulates:

  • A tag value might change during a brief disconnection and the change is missed
  • The PLC program might be updated with new initial values
  • Clock drift between the gateway and cloud can create gaps in time-series data

The hourly reset works by comparing the current system hour to the hour of the last reading. When the hour changes, all tags have their "read once" flag reset, forcing a complete re-read:

current_hour = localtime(now).hour
previous_hour = localtime(last_reading_time).hour

if current_hour != previous_hour:
reset_all_tags() # Clear "readed_once" flag
log("Force reading all tags — hourly reset")

This creates natural "checkpoints" in your time-series data. If you ever need to verify that the gateway was functioning correctly at a given time, you can look for these hourly full-read batches.

Buffered Delivery: Surviving MQTT Disconnections

The PLC connection is only half the story. The other critical link is between the gateway and the cloud (typically over MQTT). When this link drops — cellular blackout, broker maintenance, DNS failure — you need to buffer data locally.

A well-designed telemetry buffer uses a page-based architecture:

┌────────┐ ┌────────┐ ┌────────┐ ┌────────┐
│ Free │ │ Work │ │ Used │ │ Used │
│ Page │ │ Page │ │ Page 1 │ │ Page 2 │
│ │ │ (writing) │ │ (queued) │ │ (sending)│
└────────┘ └────────┘ └────────┘ └────────┘
  • Work page: Currently being written to by the tag reader
  • Used pages: Full pages queued for MQTT delivery
  • Free pages: Delivered pages recycled for reuse
  • Overflow: When free pages run out, the oldest used page is sacrificed (data loss, but the system keeps running)

Each page tracks the MQTT packet ID assigned by the broker. When the broker confirms delivery (PUBACK for QoS 1), the page is moved to the free list. If the connection drops mid-delivery, the packet_sent flag is cleared, and delivery resumes from the same position when the connection recovers.

Buffer sizing rule of thumb: At least 3 pages, each sized to hold 60 seconds of telemetry data. For a typical 50-tag device polling every second, that's roughly 4KB per page. A 64KB buffer gives you ~16 pages — enough to survive a 15-minute connectivity gap.

Practical Deployment Checklist

Before deploying a gateway to the factory floor:

  • Test cable disconnection: Unplug the Ethernet cable. Does the gateway detect it within 10 seconds? Does it reconnect automatically?
  • Test PLC power cycle: Turn off the PLC. Does the gateway show "Link Down"? Turn it back on. Does data resume without manual intervention?
  • Test MQTT broker outage: Kill the broker. Does local buffering engage? Restart the broker. Does buffered data arrive in order?
  • Test serial noise (for RTU): Introduce a ground loop or VFD near the RS-485 cable. Does the gateway detect errors without crashing?
  • Test hourly reset: Wait for the hour boundary. Do all tags get re-read?
  • Monitor link-state transitions: Over 24 hours, how many disconnections occur? More than 2/hour indicates a cabling or electrical issue.

How machineCDN Handles This

machineCDN's edge gateway software implements all of these patterns natively. The daemon tracks link state as a first-class virtual tag, buffers telemetry through MQTT disconnections using page-based memory management, and automatically recovers connections across Modbus TCP, Modbus RTU, and EtherNet/IP — with protocol-specific retry logic tuned from thousands of deployments in plastics manufacturing, auxiliary equipment, and temperature control systems.

When you connect a machine through machineCDN, the platform knows the difference between "the machine stopped" and "the gateway lost connection" — a distinction that most IIoT platforms can't make.

Conclusion

Connection resilience isn't a feature you add later. It's an architectural decision that determines whether your IIoT deployment survives its first month on the factory floor. The core principles:

  1. Track link state explicitly — as a deliverable tag, not just a log message
  2. Handle each protocol's failure modes — Modbus TCP, RTU, and EtherNet/IP all fail differently
  3. Buffer through MQTT outages — page-based buffers with delivery confirmation
  4. Force-read periodically — hourly resets prevent drift and create verification checkpoints
  5. Retry intelligently — back off after consecutive failures instead of hammering dead connections

Build these patterns into your gateway from day one, and your monitoring system will be as reliable as the machines it's watching.