Fleet Management for Multi-Plant Plastics Operations: Centralized Visibility Across 50–500+ Machines
Running a single plastics plant is complex enough. When you scale to two, three, or ten facilities — each with dozens of injection molding presses, extruders, blow molding machines, and secondary operations — complexity doesn't just increase. It multiplies.
The plant manager at your Wisconsin facility is tracking cycle times on 40 injection presses. Your Texas extrusion site runs 15 lines around the clock. Your Mexico plant handles secondary operations — trimming, assembly, pad printing. Each facility has its own tribal knowledge, its own definition of "good," and its own spreadsheets tracking downtime.
This is where fleet management becomes the difference between scaling successfully and drowning in operational blind spots.

The Multi-Plant Problem in Plastics Manufacturing
Plastics operations face fleet management challenges that other manufacturing verticals don't encounter. Unlike discrete assembly plants where machines perform similar operations, a plastics operation mixes fundamentally different process types:
- Injection molding machines running cycles from 15 seconds (thin-wall packaging) to 120+ seconds (thick automotive parts), with critical parameters like melt temperature, injection pressure, pack/hold pressure, and cooling time
- Extrusion lines running continuously for days or weeks, where barrel zone temperatures, screw RPM, die pressure, and haul-off speed must stay in tight windows
- Blow molding machines with parison control, blow pressure, and cooling timing
- Secondary operations — trimming, printing, welding, assembly — with completely different equipment types and monitoring needs
A fleet management system that works for a CNC machine shop won't cut it. Plastics manufacturers need a system that understands the fundamentally different operational profiles of each process type — and lets you organize, benchmark, and monitor them accordingly.
What Happens Without Centralized Fleet Visibility
The symptoms of fragmented fleet management are predictable and expensive:
Inconsistent performance across plants. Your Wisconsin plant runs 82% OEE on similar machines to your Texas plant at 74%. Nobody knows why because the data lives in different systems — or worse, in shift supervisor notebooks.
Reactive maintenance spirals. When maintenance data isn't centralized, each plant develops its own PM schedules independently. Your highest-performing plant's maintenance practices never transfer to your struggling sites because nobody can see the correlation between maintenance actions and uptime.
Quality blind spots. Scrap rates of 4% at one facility and 7% at another don't trigger investigation when the data isn't visible side by side. That 3-point gap on a $20M resin spend represents $600K in wasted material annually.
Capital allocation guesswork. Without cross-plant utilization data, you're making $500K+ machine purchase decisions based on plant manager requests rather than fleet-wide capacity analysis. You might buy a new 500-ton press for Plant A when Plant B's identical machine runs at 60% utilization.
Zone-Based Organization: Structuring Your Plastics Fleet
The foundation of effective multi-plant fleet management is organizing machines into logical zones that reflect how plastics operations actually work. A flat list of 200 machines across three plants is useless. You need hierarchy.
Location → Zone → Machine Hierarchy
The most effective structure for plastics manufacturers follows a three-tier model:
Level 1: Location (Plant) Each physical facility gets its own location with site-level metrics — total OEE, energy consumption, aggregate uptime, headcount efficiency.
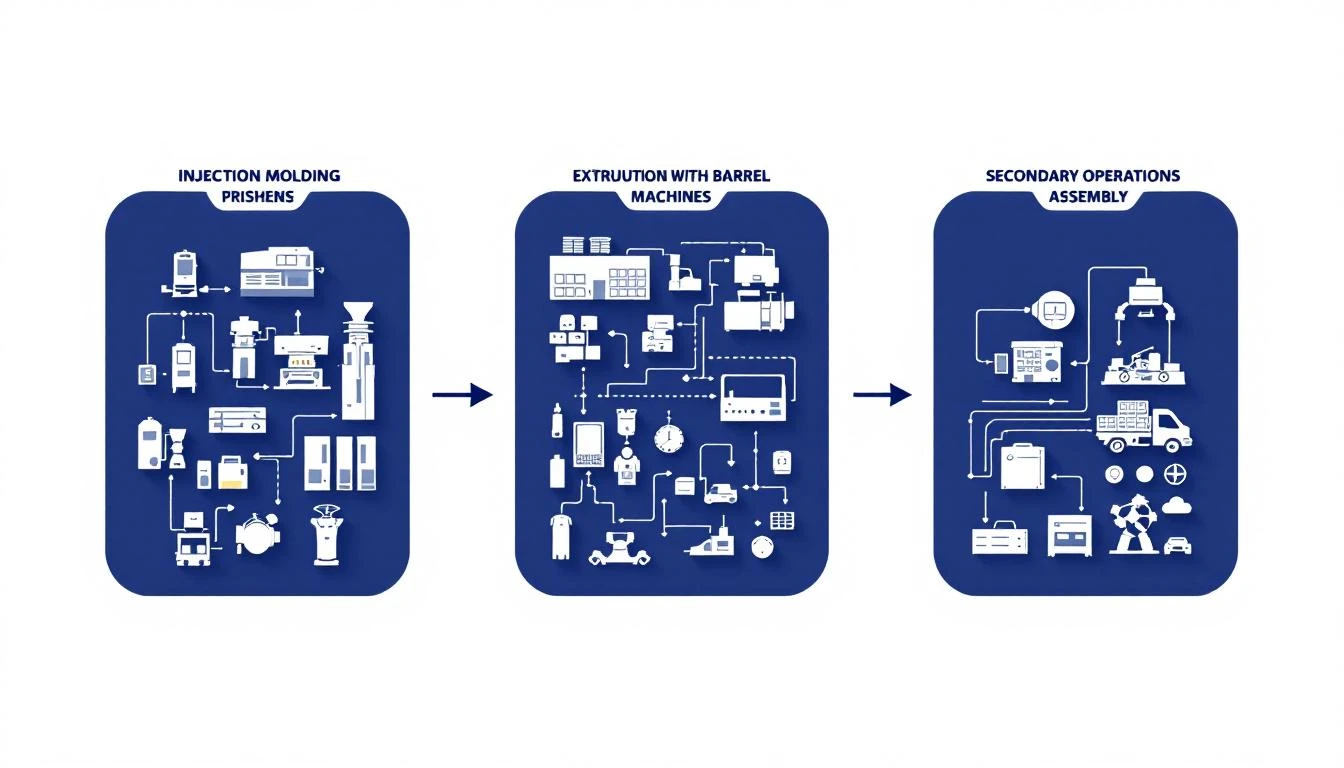
Level 2: Zone (Process Area) Within each plant, zones group machines by process type and function:
- Molding Zone — All injection presses, organized by tonnage range (< 200T, 200–500T, 500T+)
- Extrusion Zone — Single-screw lines, twin-screw lines, profile extrusion, film/sheet extrusion
- Blow Molding Zone — Extrusion blow, injection blow, stretch blow
- Secondary Ops Zone — Trimming, assembly, printing, welding, quality inspection
- Material Handling Zone — Dryers, blenders, conveyors, hoppers, silos
Level 3: Machine (Individual Asset) Each machine with its specific parameters, maintenance history, alarm profile, and performance data.
Why Zone-Based Organization Matters for Plastics
Unlike a metal stamping operation where most machines are fundamentally similar, plastics zones have completely different operational characteristics:
Molding zones care about cycle time adherence, shot weight consistency, cushion position, and mold-specific parameters. A molding zone might run 40 different molds across 20 presses in a week. You need to track performance by machine and by mold.
Extrusion zones care about continuous run time, temperature profile stability, dimensional accuracy, and throughput rate. Extrusion isn't about cycles — it's about continuous process stability over hours and days.
Secondary operations care about throughput matching — are your trimming stations keeping up with molding output, or are parts queuing up? Are your assembly cells balanced?
Grouping these into zones means your injection molding supervisor sees molding-relevant KPIs without wading through extrusion data, while your plant manager gets a zone-level rollup that shows the entire facility at a glance.
Cross-Plant Benchmarking: Finding the Hidden 10%
Cross-plant benchmarking is where fleet management pays for itself. When you can compare identical or similar machines across facilities, performance gaps become immediately visible — and addressable.
Benchmarking Injection Molding Operations
Consider two plants both running 300-ton hydraulic presses producing the same part family:
| Metric | Plant A (Wisconsin) | Plant B (Texas) |
|---|---|---|
| Average Cycle Time | 42.3s | 45.1s |
| Scrap Rate | 3.2% | 5.8% |
| Planned vs. Actual Uptime | 91% | 84% |
| Mold Change Time | 38 min | 52 min |
| Energy per Part | 0.42 kWh | 0.51 kWh |
Every one of these gaps represents money. The 2.8-second cycle time difference means Plant B produces roughly 6% fewer parts per shift. The scrap delta on a $5/lb resin running 500 lbs/day per machine is nearly $50K/year — per machine.
Without fleet-wide visibility, these gaps persist for months or years. A plant manager in Texas has no idea their mold change process takes 37% longer than Wisconsin's because they've never seen the comparison.
Benchmarking Extrusion Operations
Extrusion benchmarking focuses on different parameters:
- Throughput rate (lbs/hr) for comparable line configurations
- Dimensional stability — how tightly does each line hold tolerances?
- Run length — average hours between unplanned stops
- Material yield — how much scrap during startup, shutdown, and transitions?
- Energy intensity — kWh per pound of output
A fleet management platform that tracks these metrics across all extrusion lines — regardless of which plant they're in — lets you identify your top-performing lines and replicate their settings, maintenance practices, and operating procedures across the fleet.
Real-Time Monitoring Across the Fleet
Fleet management isn't just about historical benchmarking. The operational value comes from real-time visibility across all facilities simultaneously.
The Single-Pane-of-Glass Challenge
Most plastics manufacturers start their IIoT journey at one plant. They install monitoring on their injection presses, get comfortable with the data, and then face the question: how do we scale this to our other facilities?
This is where many IIoT platforms fail. They were designed for single-site deployments and bolt on multi-site capabilities as an afterthought. The result is separate dashboards for each plant with no unified view.
A purpose-built fleet management approach gives you:
- Fleet-level dashboard — Overall machine status across all plants on a single screen. Green (running), yellow (idle), red (alarmed) at a glance.
- Drill-down navigation — Click from fleet → plant → zone → machine without switching applications or logging into different systems.
- Cross-plant alarm aggregation — All active alarms from all facilities in one prioritized list, not siloed by plant.
- Unified reporting — Generate OEE, downtime, or energy reports that span multiple facilities with consistent calculations.
Connectivity That Scales
Adding monitoring to a new plant should take days, not months. The bottleneck in most multi-plant IIoT deployments isn't the software — it's the connectivity.
Traditional approaches require:
- Engaging each plant's IT team for network access
- Configuring firewalls, VPNs, and VLANs
- Deploying on-premise servers
- Months of integration work per facility
Modern approaches using cellular edge connectivity bypass plant networks entirely. An edge device with a cellular connection sits on the plant floor, connects directly to each machine via standard industrial protocols, and streams data to the cloud. No IT involvement. No network changes. A machine can go from unmonitored to fully connected in minutes — regardless of which plant it's in.
This is how you scale from 50 machines to 500 without a multi-year, multi-million-dollar IT project.
Alarm Management Across Multiple Facilities
When you're managing hundreds of machines across multiple plants, alarm management becomes critical. Without a structured approach, you'll drown in noise.
Tiered Alarm Strategy for Plastics
Critical Alarms (Immediate Action Required)
- Barrel heater failure on extruders (risk of screw seizure)
- Hydraulic oil temperature exceeding limits on injection presses
- Nozzle thermocouple failure during production
- Safety circuit activation
- Mold cooling water flow loss
Warning Alarms (Investigate Within Shift)
- Process parameters drifting outside normal range but within spec
- Cycle time deviation exceeding 5% from standard
- Energy consumption spike on a specific machine
- Hopper level approaching minimum
- Approaching scheduled PM due date
Informational Alarms (Review Daily)
- Mold shot count milestones
- Cumulative run time thresholds
- Efficiency trending below target but not critical
The key is configuring smart alarm thresholds that are specific to each machine type. A 5°C temperature deviation on an injection barrel zone might be informational, while the same deviation on an extrusion die zone is critical. Your fleet management system must support machine-type-specific alarm profiles that can be templated and deployed across plants.
Maintenance Coordination Across Plants
Multi-plant operations create unique maintenance challenges that single-site operations don't face.
Spare Parts Visibility
When you have 80 injection presses across four plants, spare parts management becomes a fleet-level concern. Does Plant A have the hydraulic valve that Plant C needs for an emergency repair? Can you transfer the backup screw and barrel assembly from Plant B's extrusion department to Plant D?
Fleet-level spare parts tracking gives you:
- Inventory visibility across all locations
- Cross-plant part transfer capabilities
- Consolidated purchasing (one PO for all plants vs. four separate orders)
- Usage pattern analysis to optimize stocking levels fleet-wide
PM Schedule Optimization
With fleet-wide data, you can move beyond time-based maintenance to condition-based and predictive maintenance. Instead of changing hydraulic filters every 2,000 hours regardless of condition, you monitor actual pressure differential across all machines and change filters when data indicates degradation.
The fleet-level benefit: when you discover that a particular filter brand lasts 30% longer based on data from 80 machines, you apply that insight everywhere — not just at the plant where someone happened to notice.
Energy Management at Fleet Scale
Energy costs in plastics manufacturing are substantial — typically 5–10% of total production cost. For a multi-plant operation running $100M in annual production, that's $5–10M in energy spend.
Fleet-level energy monitoring reveals optimization opportunities invisible at the plant level:
- Time-of-use optimization: Shift energy-intensive operations (barrel heating, dryer startup) to off-peak hours. Different plants in different utility territories have different rate structures — fleet visibility lets you optimize globally.
- Machine efficiency comparison: That 500-ton press at Plant A consuming 20% more energy per cycle than the identical press at Plant B? The difference might be a worn check valve, a cooling system inefficiency, or suboptimal barrel insulation.
- Demand charge management: Staggering startup times across machines to avoid demand spikes becomes critical when you're managing utility contracts across multiple locations.
Building Your Fleet Management Roadmap
Scaling from single-plant monitoring to fleet management should be deliberate, not chaotic.
Phase 1: Pilot Plant (Weeks 1–5)
- Deploy monitoring on your most data-mature plant
- Connect 10–20 machines across 2–3 process zones
- Establish baseline KPIs: OEE, downtime, energy, scrap rates
- Prove value and build internal champions
Phase 2: Second Plant (Weeks 6–10)
- Replicate deployment at a second facility
- Begin cross-plant benchmarking
- Standardize alarm configurations and KPI definitions
- Identify first performance gaps and quick wins
Phase 3: Fleet Rollout (Weeks 11–20)
- Extend to remaining facilities
- Implement fleet-level dashboards and reporting
- Deploy standardized PM programs based on fleet data
- Establish continuous improvement cadence
Phase 4: Fleet Optimization (Ongoing)
- Cross-plant best practice sharing based on data
- AI-driven anomaly detection across the fleet
- Predictive models trained on fleet-wide data (more data = better predictions)
- Capital planning driven by fleet utilization analytics
The ROI of Fleet-Level Visibility
For a multi-plant plastics operation running 200+ machines, fleet management typically delivers:
- 2–5% OEE improvement through cross-plant benchmarking and best practice transfer ($500K–$2M annually on a $50M operation)
- 15–30% reduction in unplanned downtime via predictive maintenance scaled across the fleet
- 3–8% energy savings through optimization and waste identification
- 20–40% reduction in spare parts inventory via cross-plant visibility and consolidated purchasing
- 50%+ faster root cause analysis when quality issues arise at any facility
The payback period for most multi-plant IIoT deployments is under 6 months. With deployment approaches that get machines connected in minutes rather than months, you start generating ROI from day one — not after a year-long IT project.
Conclusion: Scale Your Plastics Operations With Confidence
Multi-plant plastics manufacturing demands fleet management that understands the unique operational profiles of injection molding, extrusion, blow molding, and secondary operations. Zone-based organization, cross-plant benchmarking, unified alarm management, and fleet-level maintenance coordination transform operational chaos into systematic improvement.
The manufacturers who thrive at scale aren't the ones with the newest equipment. They're the ones with the best visibility — across every machine, every zone, and every plant.
Ready to bring fleet-level visibility to your multi-plant plastics operation? Book a demo and see how fast you can connect your first facility.